| __timestamp | CDW Corporation | Infosys Limited |
|---|---|---|
| Wednesday, January 1, 2014 | 1248300000 | 1079000000 |
| Thursday, January 1, 2015 | 1373800000 | 1176000000 |
| Friday, January 1, 2016 | 1508000000 | 1020000000 |
| Sunday, January 1, 2017 | 1583800000 | 1279000000 |
| Monday, January 1, 2018 | 1719600000 | 1220000000 |
| Tuesday, January 1, 2019 | 1906300000 | 1504000000 |
| Wednesday, January 1, 2020 | 2030900000 | 1223000000 |
| Friday, January 1, 2021 | 2149500000 | 1391000000 |
| Saturday, January 1, 2022 | 2951400000 | 1678000000 |
| Sunday, January 1, 2023 | 2971500000 | 1632000000 |
| Monday, January 1, 2024 | 2951100000 |
In pursuit of knowledge
In the ever-evolving landscape of technology, operational efficiency remains a cornerstone of success. Over the past decade, Infosys Limited and CDW Corporation have demonstrated distinct trajectories in their Selling, General, and Administrative (SG&A) expenses. From 2014 to 2023, CDW Corporation's SG&A expenses surged by approximately 138%, reflecting its aggressive expansion and market penetration strategies. In contrast, Infosys Limited exhibited a more conservative growth of around 51% in the same period, underscoring its focus on sustainable scaling and cost management.
By 2023, CDW's SG&A expenses were nearly 82% higher than those of Infosys, highlighting the differing operational strategies of these tech titans. This analysis not only provides insights into their financial health but also offers a glimpse into their strategic priorities. As the tech industry continues to evolve, understanding these trends is crucial for investors and stakeholders alike.
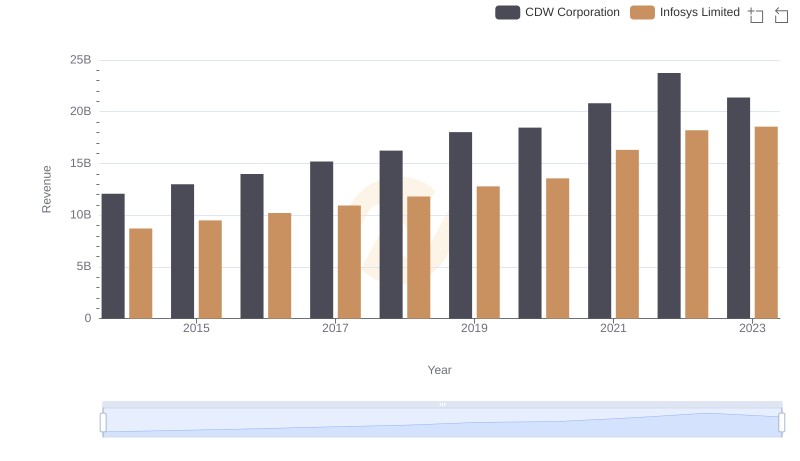
Revenue Insights: Infosys Limited and CDW Corporation Performance Compared
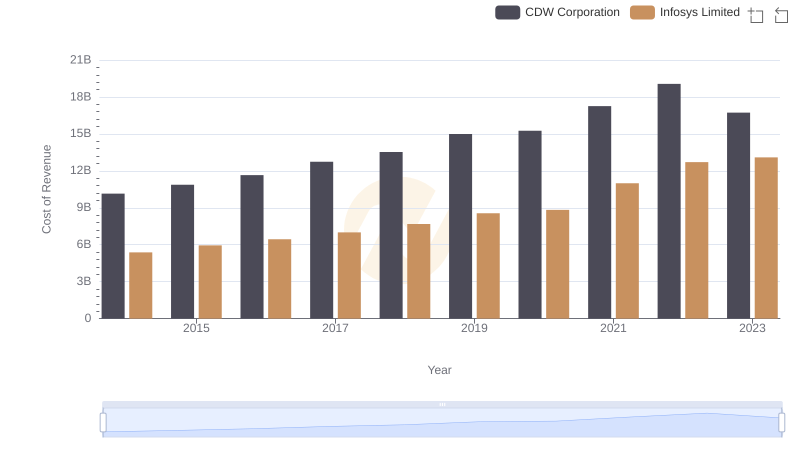
Cost of Revenue: Key Insights for Infosys Limited and CDW Corporation
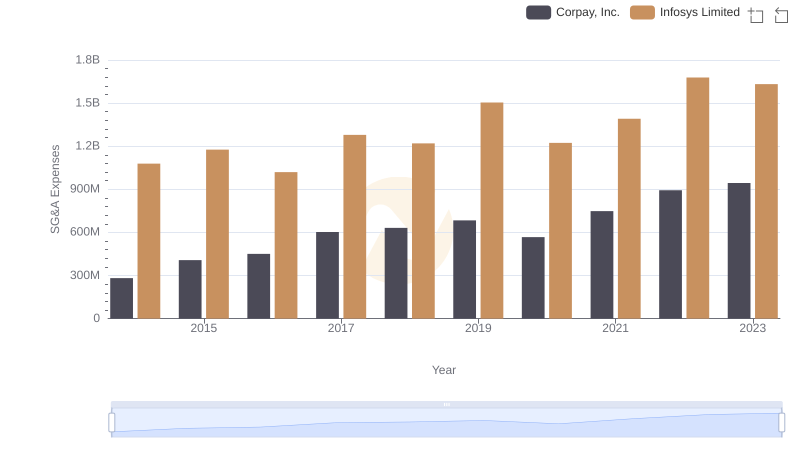
Comparing SG&A Expenses: Infosys Limited vs Corpay, Inc. Trends and Insights
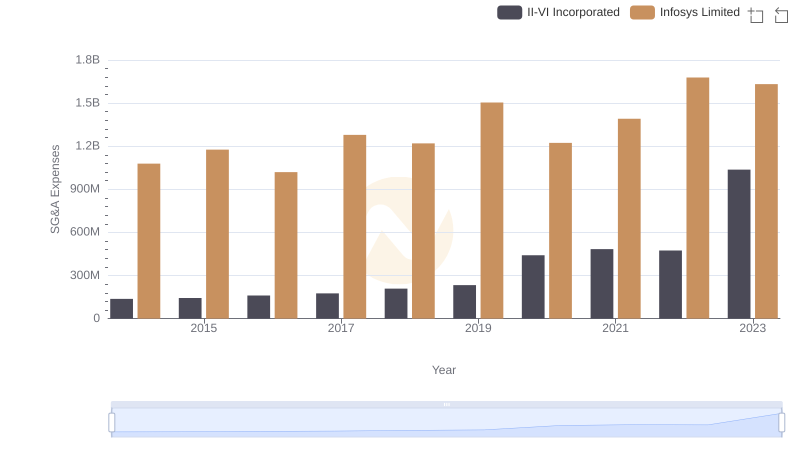
Cost Management Insights: SG&A Expenses for Infosys Limited and II-VI Incorporated
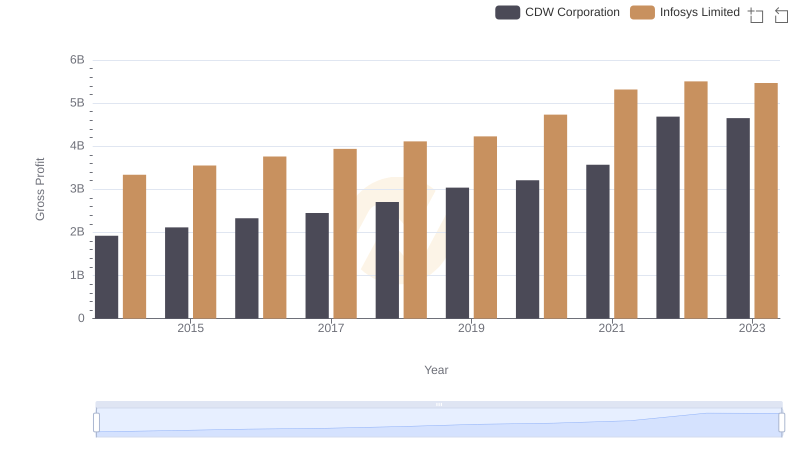
Who Generates Higher Gross Profit? Infosys Limited or CDW Corporation
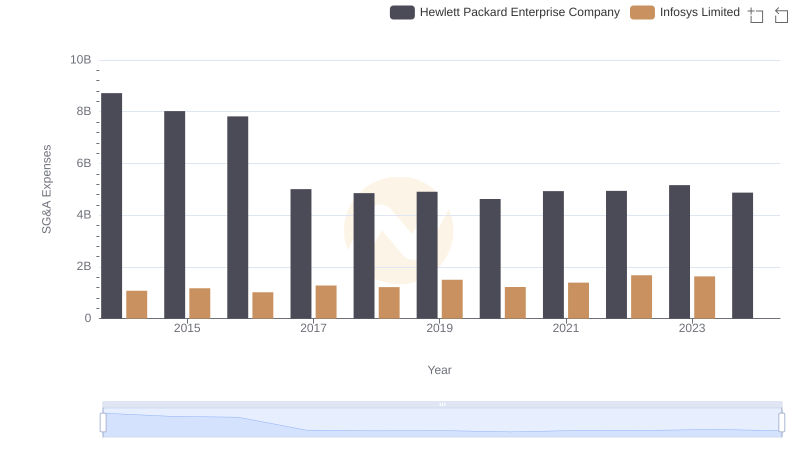
Who Optimizes SG&A Costs Better? Infosys Limited or Hewlett Packard Enterprise Company
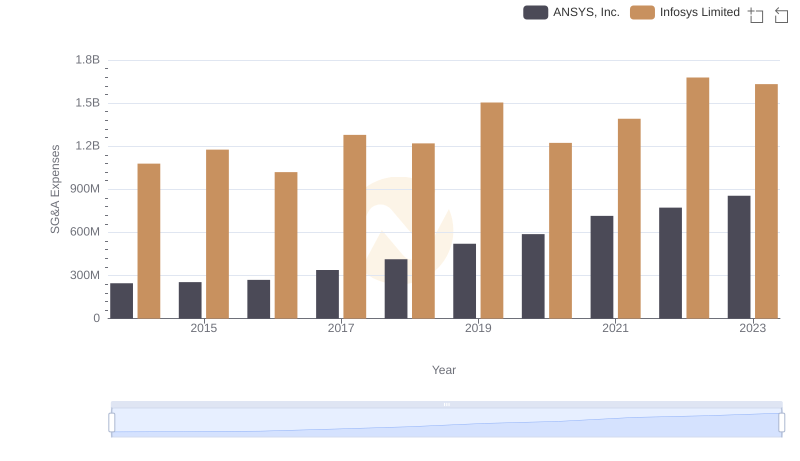
Comparing SG&A Expenses: Infosys Limited vs ANSYS, Inc. Trends and Insights
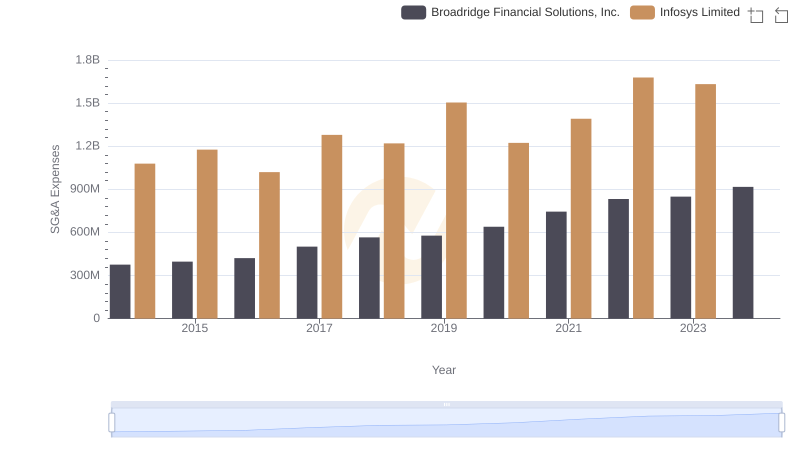
Comparing SG&A Expenses: Infosys Limited vs Broadridge Financial Solutions, Inc. Trends and Insights
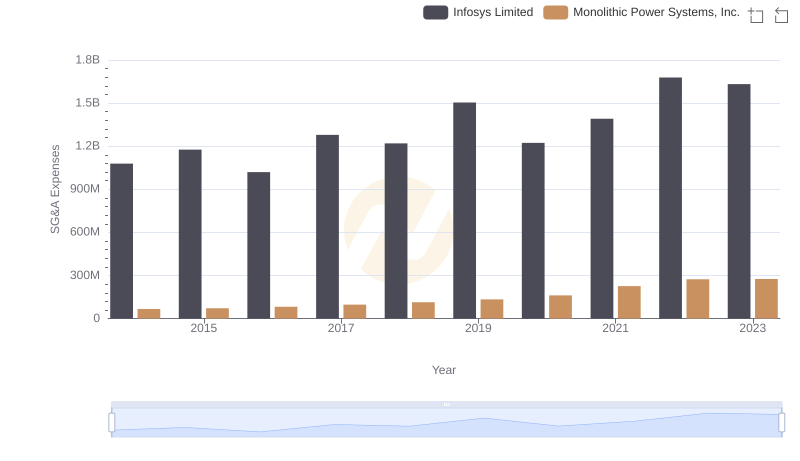
SG&A Efficiency Analysis: Comparing Infosys Limited and Monolithic Power Systems, Inc.
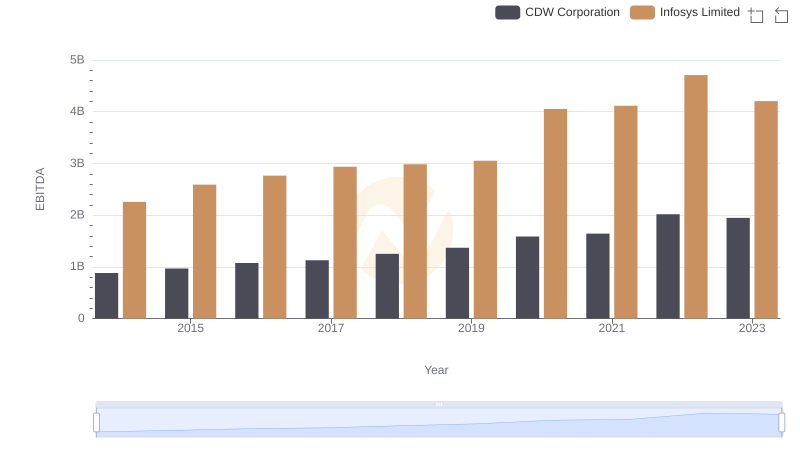
EBITDA Performance Review: Infosys Limited vs CDW Corporation
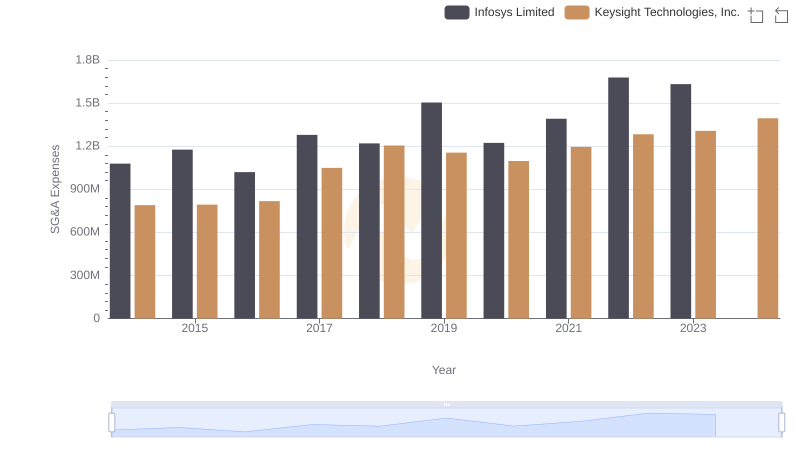
SG&A Efficiency Analysis: Comparing Infosys Limited and Keysight Technologies, Inc.
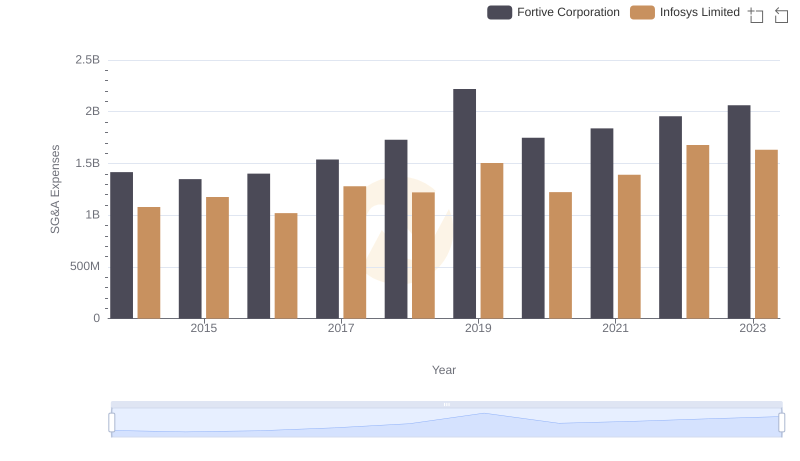
Infosys Limited vs Fortive Corporation: SG&A Expense Trends