| __timestamp | Infosys Limited | Splunk Inc. |
|---|---|---|
| Wednesday, January 1, 2014 | 8711000000 | 302623000 |
| Thursday, January 1, 2015 | 9501000000 | 450875000 |
| Friday, January 1, 2016 | 10208000000 | 668435000 |
| Sunday, January 1, 2017 | 10939000000 | 949955000 |
| Monday, January 1, 2018 | 11799000000 | 1270788000 |
| Tuesday, January 1, 2019 | 12780000000 | 1803010000 |
| Wednesday, January 1, 2020 | 13561000000 | 2358926000 |
| Friday, January 1, 2021 | 16311000000 | 2229385000 |
| Saturday, January 1, 2022 | 18212000000 | 2673664000 |
| Sunday, January 1, 2023 | 18562000000 | 3653708000 |
| Monday, January 1, 2024 | 4215595000 |
Igniting the spark of knowledge
In the ever-evolving landscape of technology, revenue growth is a key indicator of a company's success. From 2014 to 2023, Infosys Limited and Splunk Inc. have showcased distinct revenue trajectories. Infosys, a titan in the IT services sector, has seen its revenue grow by over 110%, from approximately $8.7 billion in 2014 to $18.6 billion in 2023. This steady growth underscores its robust business model and expanding global footprint.
Conversely, Splunk Inc., a leader in data analytics, has experienced a remarkable revenue surge of over 1,100%, from $302 million in 2014 to $3.65 billion in 2023. This exponential growth highlights the increasing demand for data-driven insights in the digital age. However, data for Infosys in 2024 is missing, leaving room for speculation on its future trajectory. As these companies continue to innovate, their revenue trends offer valuable insights into the tech industry's dynamic nature.
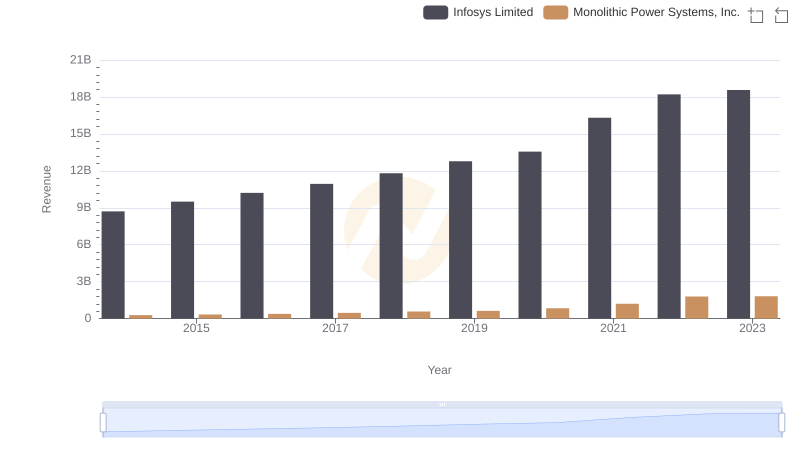
Infosys Limited vs Monolithic Power Systems, Inc.: Annual Revenue Growth Compared
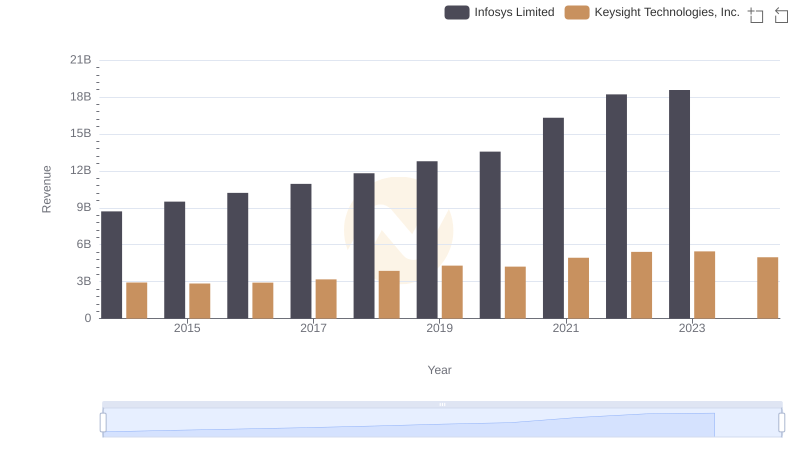
Revenue Showdown: Infosys Limited vs Keysight Technologies, Inc.
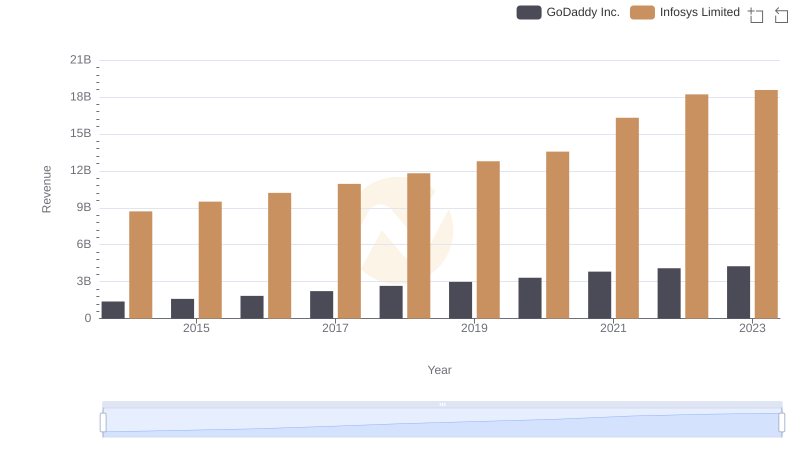
Infosys Limited or GoDaddy Inc.: Who Leads in Yearly Revenue?
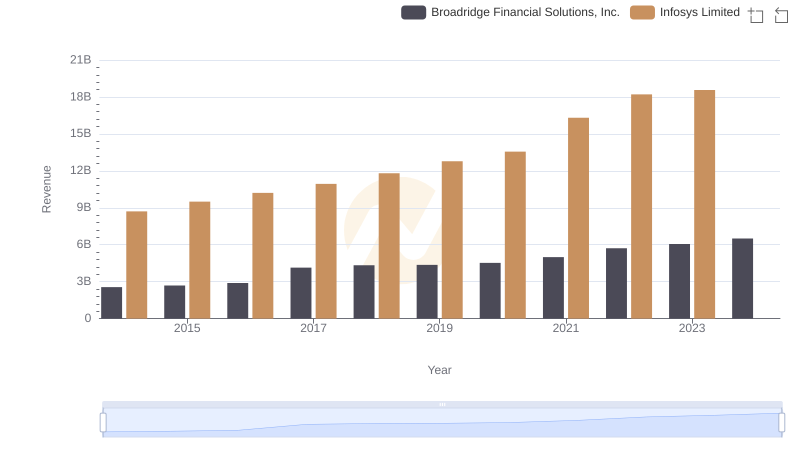
Breaking Down Revenue Trends: Infosys Limited vs Broadridge Financial Solutions, Inc.
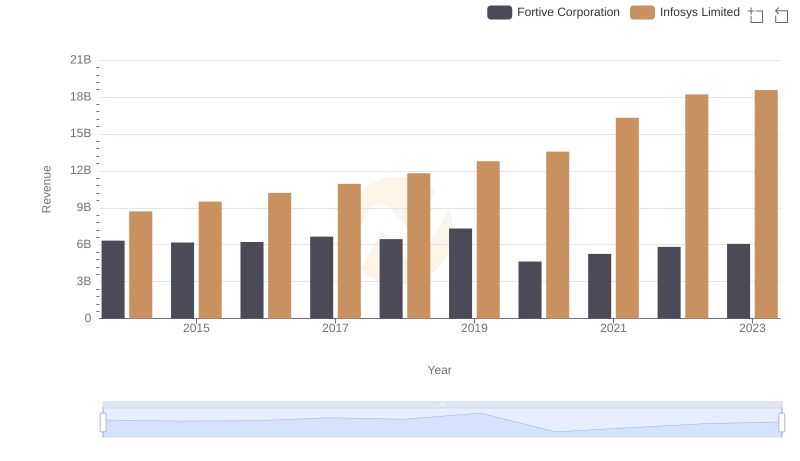
Who Generates More Revenue? Infosys Limited or Fortive Corporation
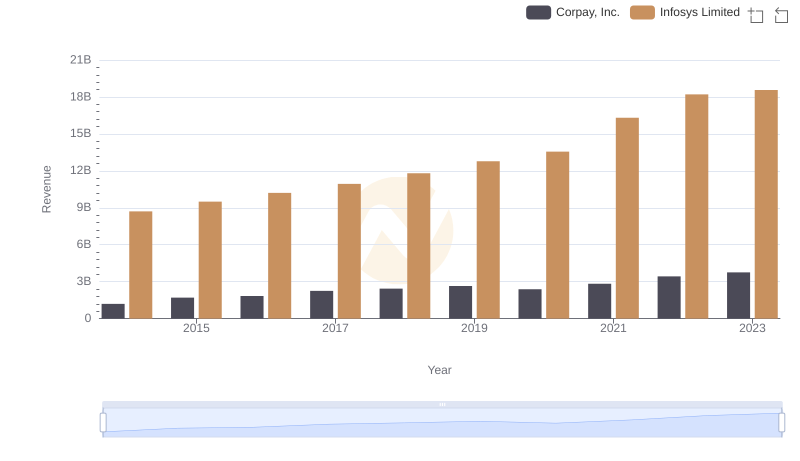
Revenue Showdown: Infosys Limited vs Corpay, Inc.
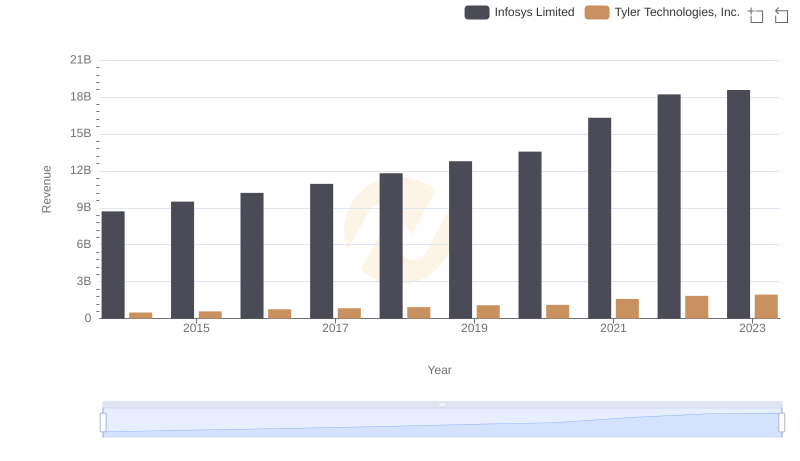
Annual Revenue Comparison: Infosys Limited vs Tyler Technologies, Inc.
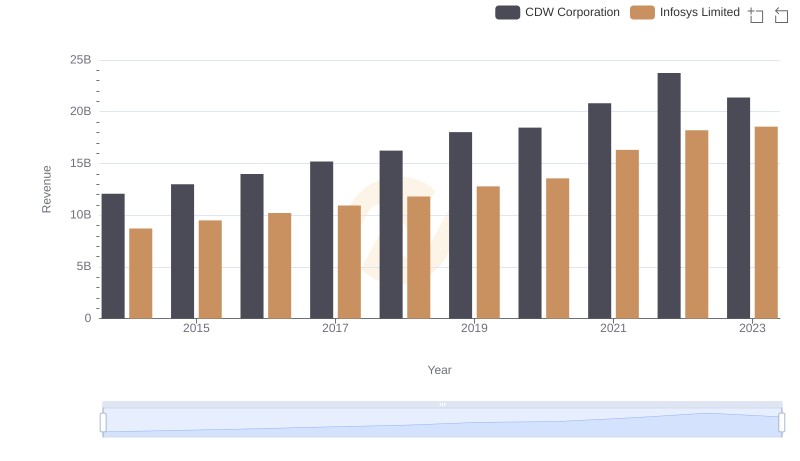
Revenue Insights: Infosys Limited and CDW Corporation Performance Compared
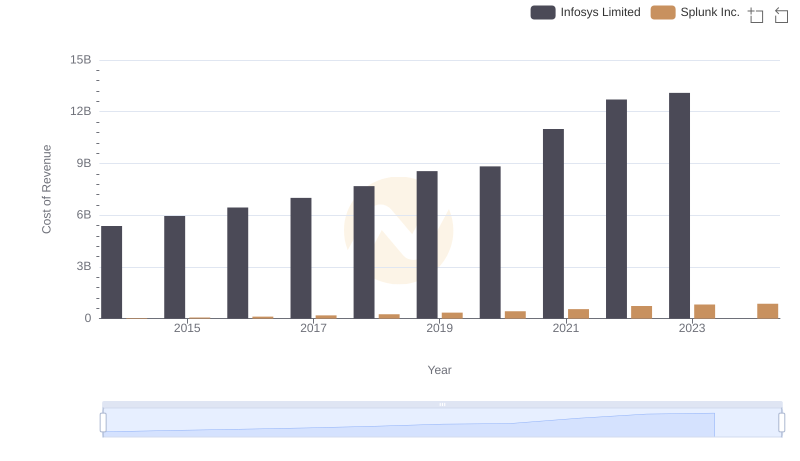
Infosys Limited vs Splunk Inc.: Efficiency in Cost of Revenue Explored
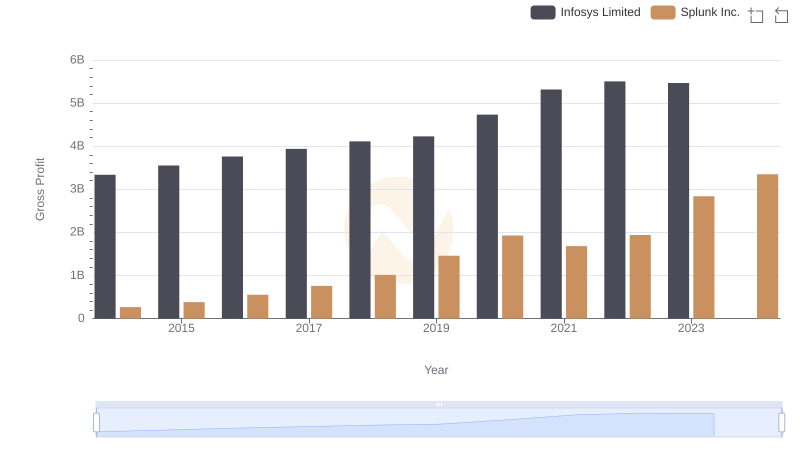
Infosys Limited and Splunk Inc.: A Detailed Gross Profit Analysis
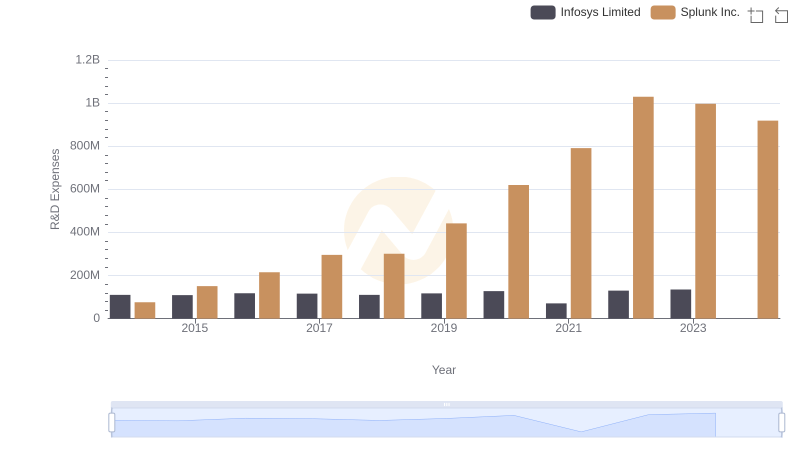
R&D Insights: How Infosys Limited and Splunk Inc. Allocate Funds
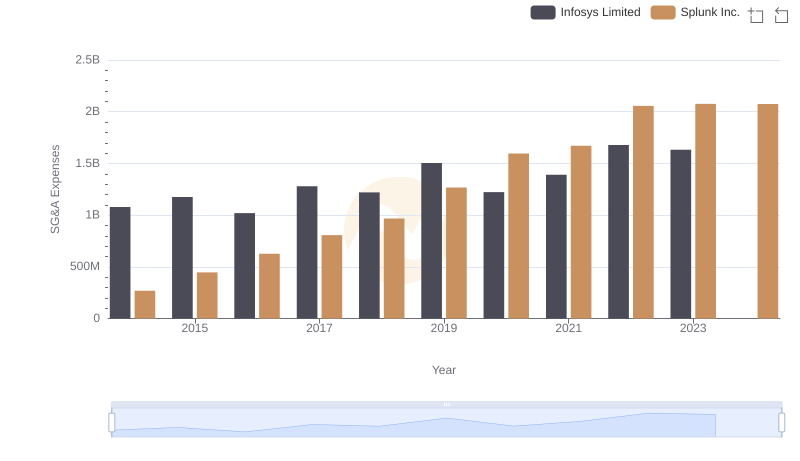
Infosys Limited vs Splunk Inc.: SG&A Expense Trends