| __timestamp | Infosys Limited | Splunk Inc. |
|---|---|---|
| Wednesday, January 1, 2014 | 110000000 | 75895000 |
| Thursday, January 1, 2015 | 108750722 | 150790000 |
| Friday, January 1, 2016 | 117660969 | 215309000 |
| Sunday, January 1, 2017 | 116030068 | 295850000 |
| Monday, January 1, 2018 | 109947154 | 301114000 |
| Tuesday, January 1, 2019 | 116915374 | 441969000 |
| Wednesday, January 1, 2020 | 127298402 | 619800000 |
| Friday, January 1, 2021 | 70997544 | 791026000 |
| Saturday, January 1, 2022 | 129656701 | 1029574000 |
| Sunday, January 1, 2023 | 135037609 | 997170000 |
| Monday, January 1, 2024 | 918834000 |
Unlocking the unknown
In the ever-evolving tech landscape, research and development (R&D) is the lifeblood of innovation. This chart offers a fascinating glimpse into how two industry leaders, Infosys Limited and Splunk Inc., have allocated their R&D budgets over the past decade. From 2014 to 2023, Splunk Inc. has consistently ramped up its R&D spending, peaking at nearly $1 billion in 2022, a staggering 13-fold increase from 2014. In contrast, Infosys Limited has maintained a more steady approach, with a 23% increase over the same period, reaching its highest expenditure in 2023. This divergence highlights Splunk's aggressive push for innovation, while Infosys opts for a more measured strategy. Notably, data for 2024 is incomplete, leaving room for speculation on future trends. As these companies continue to navigate the competitive tech arena, their R&D investments will undoubtedly shape their trajectories.
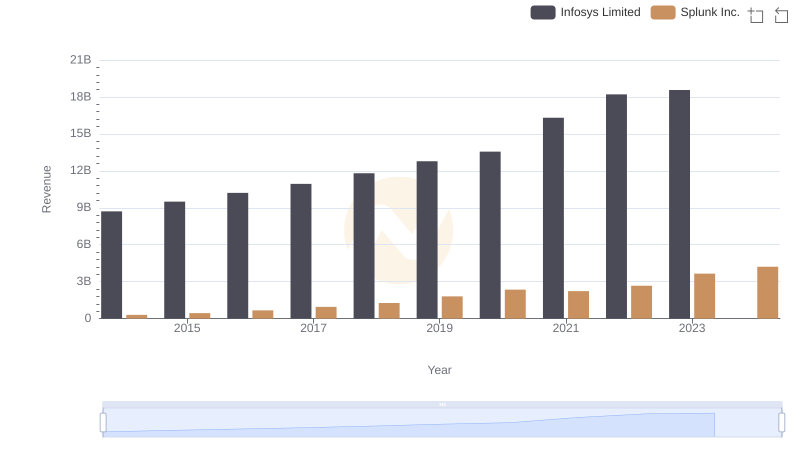
Breaking Down Revenue Trends: Infosys Limited vs Splunk Inc.
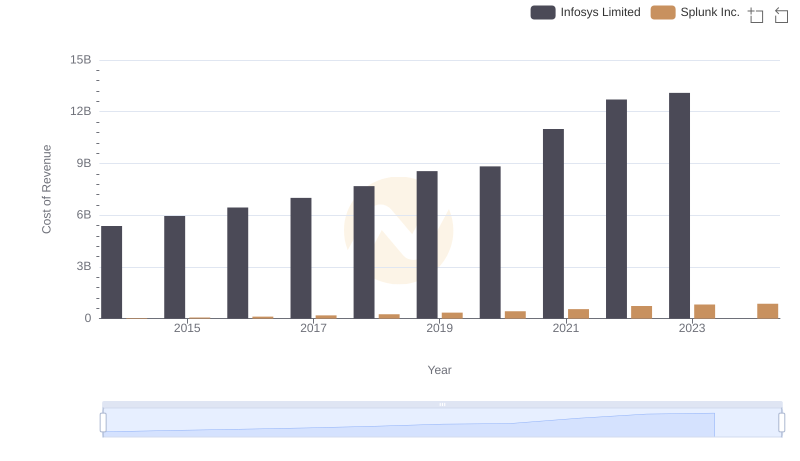
Infosys Limited vs Splunk Inc.: Efficiency in Cost of Revenue Explored
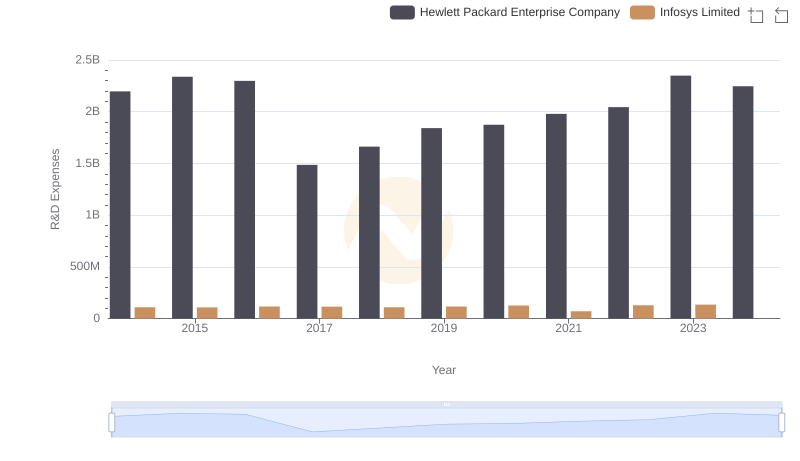
Infosys Limited vs Hewlett Packard Enterprise Company: Strategic Focus on R&D Spending
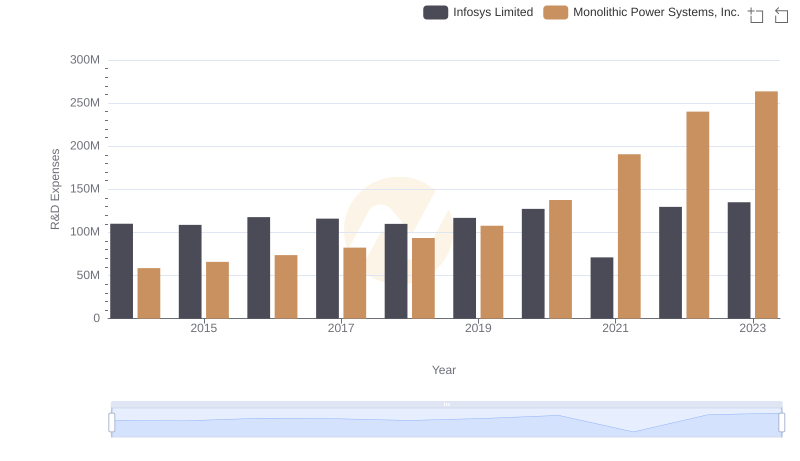
Infosys Limited or Monolithic Power Systems, Inc.: Who Invests More in Innovation?
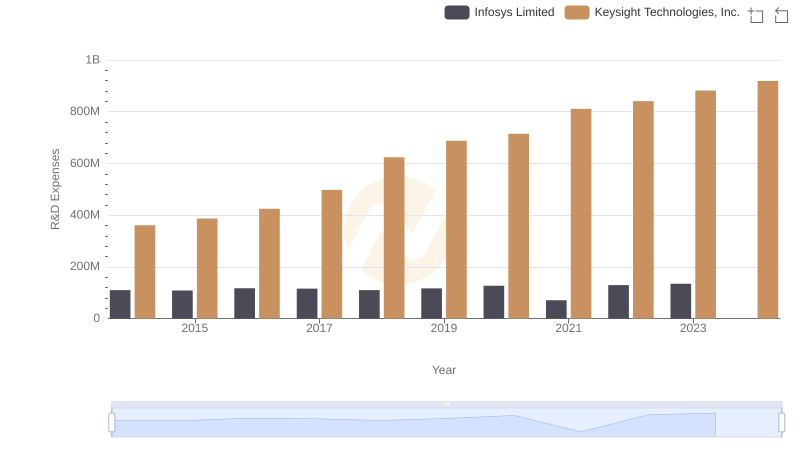
R&D Insights: How Infosys Limited and Keysight Technologies, Inc. Allocate Funds
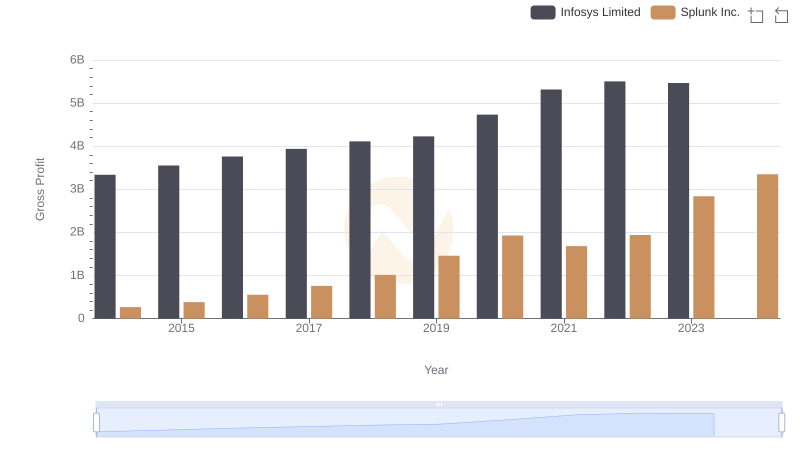
Infosys Limited and Splunk Inc.: A Detailed Gross Profit Analysis

Research and Development Expenses Breakdown: Infosys Limited vs GoDaddy Inc.
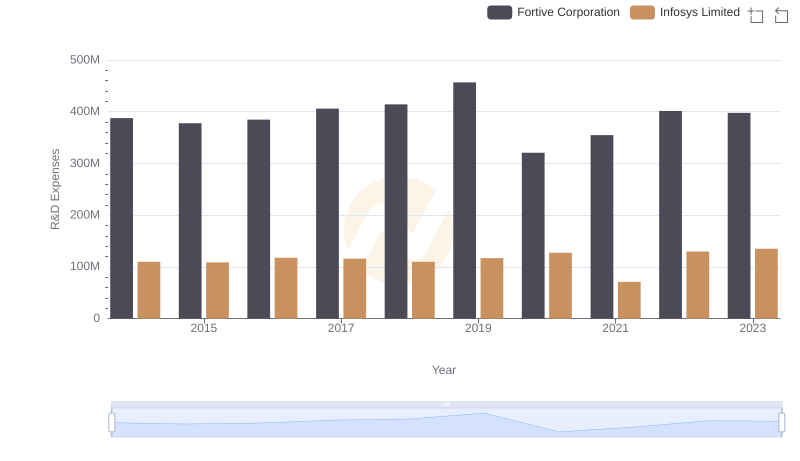
R&D Insights: How Infosys Limited and Fortive Corporation Allocate Funds
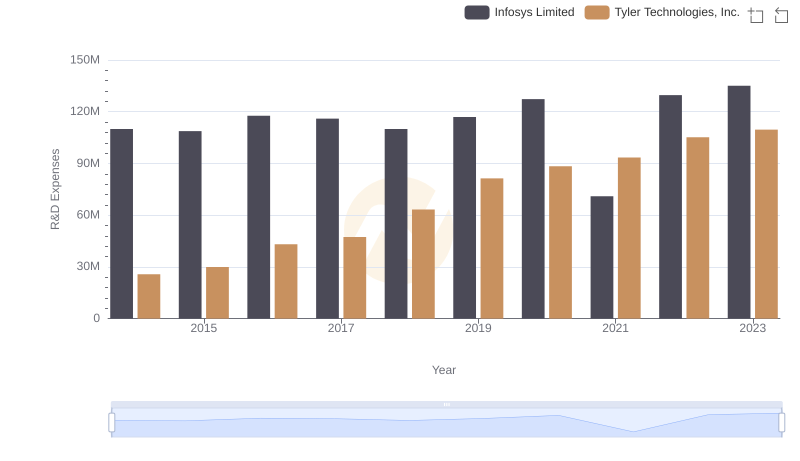
Research and Development: Comparing Key Metrics for Infosys Limited and Tyler Technologies, Inc.
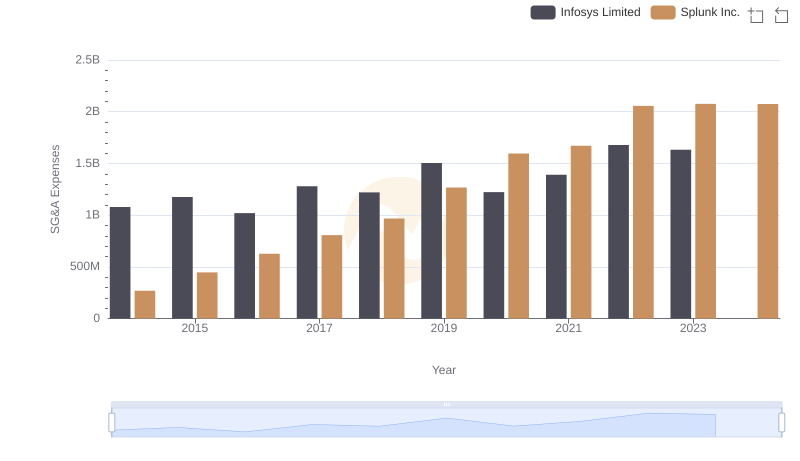
Infosys Limited vs Splunk Inc.: SG&A Expense Trends
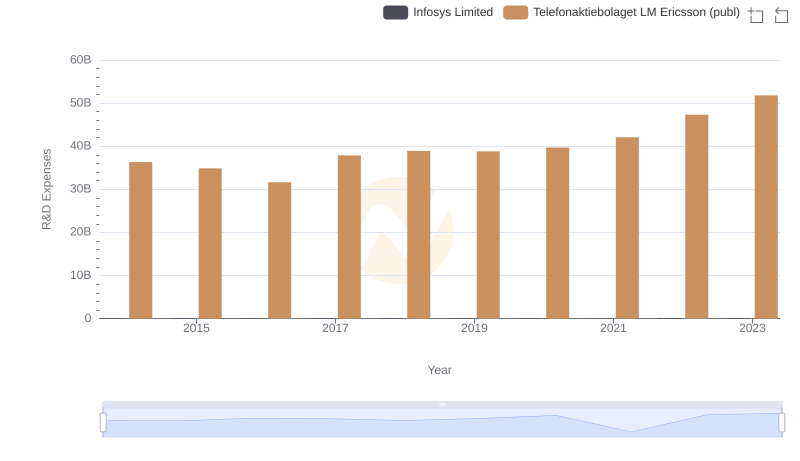
Research and Development Expenses Breakdown: Infosys Limited vs Telefonaktiebolaget LM Ericsson (publ)
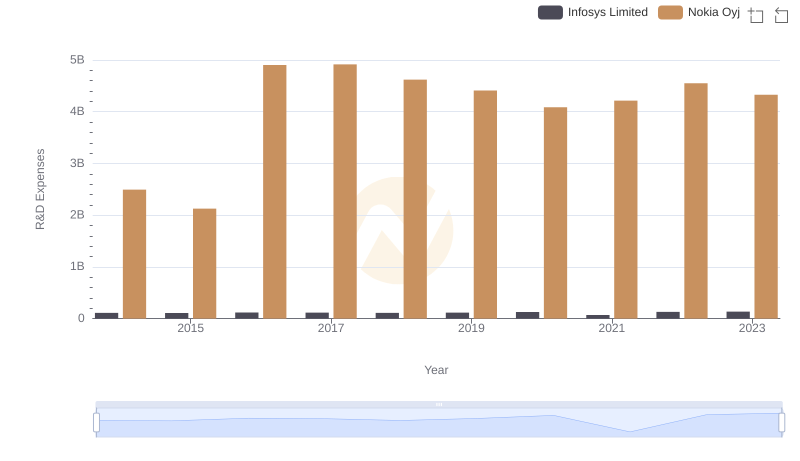
R&D Spending Showdown: Infosys Limited vs Nokia Oyj