| __timestamp | Elbit Systems Ltd. | Lennox International Inc. |
|---|---|---|
| Wednesday, January 1, 2014 | 825097000 | 903300000 |
| Thursday, January 1, 2015 | 897053000 | 947400000 |
| Friday, January 1, 2016 | 959583000 | 1076500000 |
| Sunday, January 1, 2017 | 997920000 | 1125200000 |
| Monday, January 1, 2018 | 976179000 | 1111200000 |
| Tuesday, January 1, 2019 | 1136467000 | 1079800000 |
| Wednesday, January 1, 2020 | 1165107000 | 1040100000 |
| Friday, January 1, 2021 | 1358048000 | 1188400000 |
| Saturday, January 1, 2022 | 1373283000 | 1284700000 |
| Sunday, January 1, 2023 | 1482954000 | 1547800000 |
| Monday, January 1, 2024 | 1771900000 |
Cracking the code
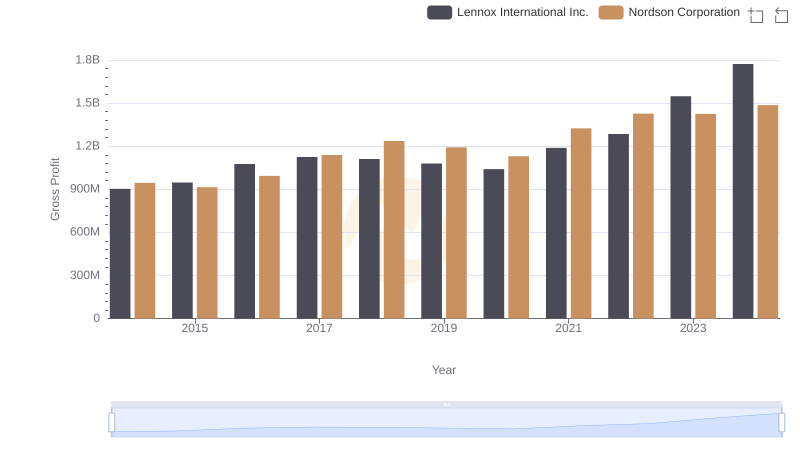
In the competitive landscape of global industries, Lennox International Inc. and Elbit Systems Ltd. have showcased remarkable financial trajectories over the past decade. From 2014 to 2023, Lennox International Inc. has consistently outperformed Elbit Systems Ltd. in terms of gross profit, with a notable 72% increase from 2014 to 2023. In contrast, Elbit Systems Ltd. experienced a 79% rise in the same period, reflecting its robust growth strategy.
Lennox International Inc. saw its gross profit peak in 2023, marking a significant milestone. Meanwhile, Elbit Systems Ltd. demonstrated steady growth, with its highest gross profit recorded in 2023 as well. The data highlights the resilience and strategic prowess of these companies, despite the absence of data for Lennox International Inc. in 2024. This comparison offers valuable insights into the financial health and strategic direction of these industry leaders.
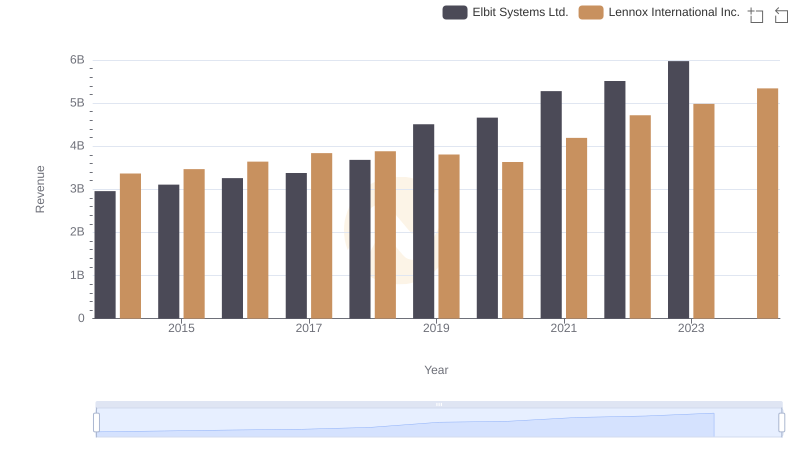
Lennox International Inc. or Elbit Systems Ltd.: Who Leads in Yearly Revenue?
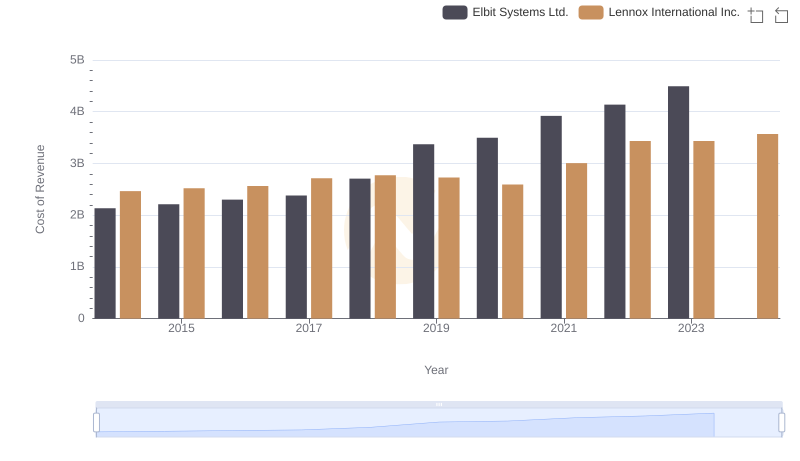
Cost of Revenue: Key Insights for Lennox International Inc. and Elbit Systems Ltd.
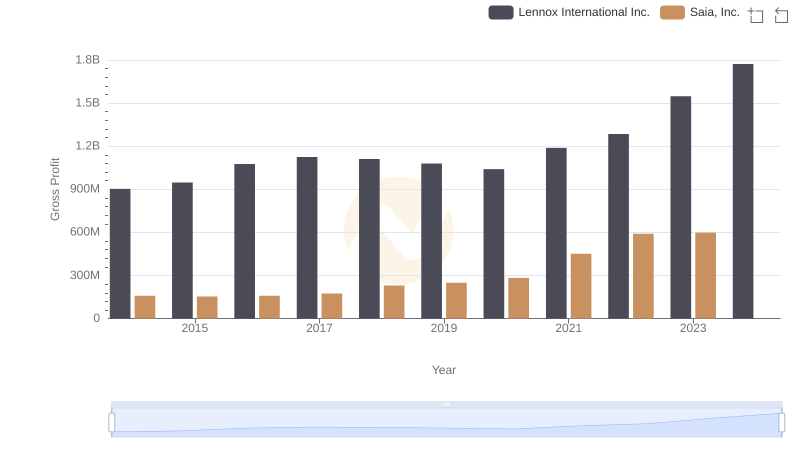
Gross Profit Trends Compared: Lennox International Inc. vs Saia, Inc.
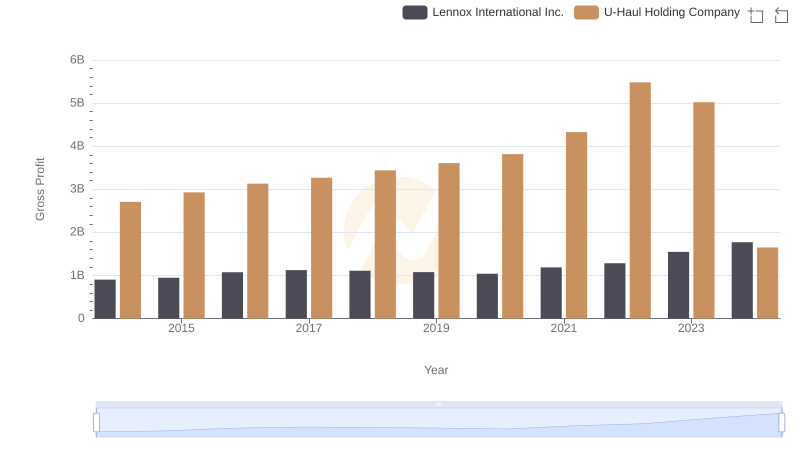
Lennox International Inc. vs U-Haul Holding Company: A Gross Profit Performance Breakdown
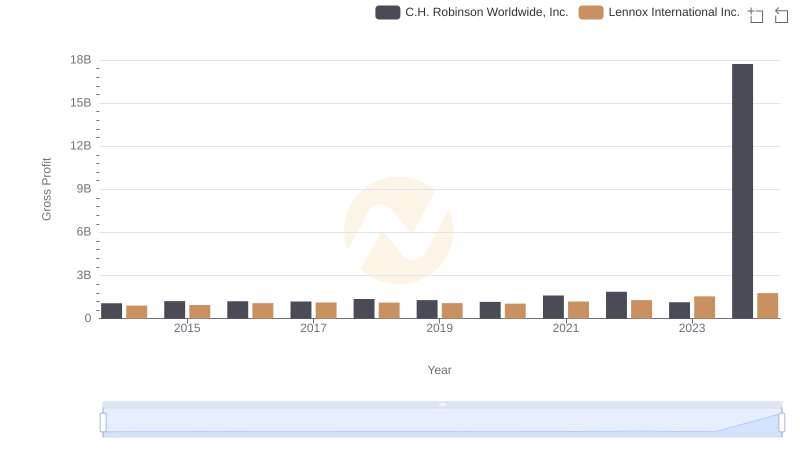
Gross Profit Analysis: Comparing Lennox International Inc. and C.H. Robinson Worldwide, Inc.
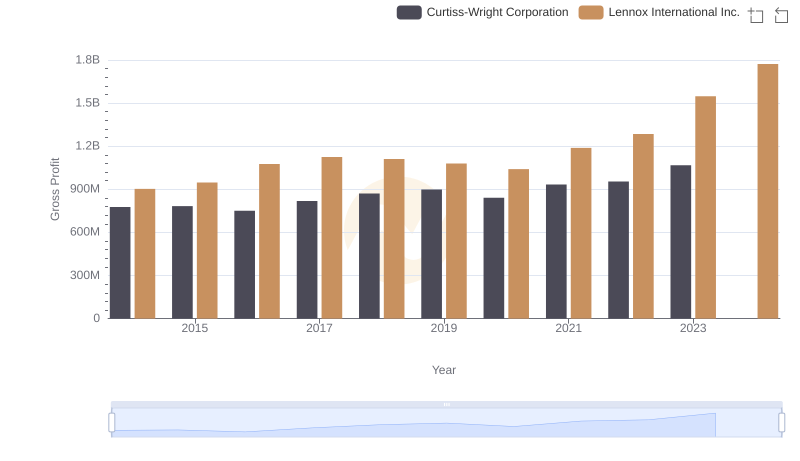
Gross Profit Trends Compared: Lennox International Inc. vs Curtiss-Wright Corporation
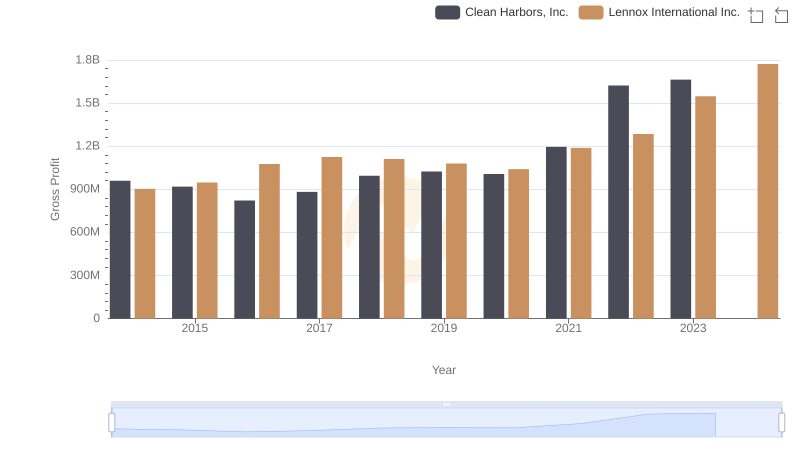
Gross Profit Trends Compared: Lennox International Inc. vs Clean Harbors, Inc.
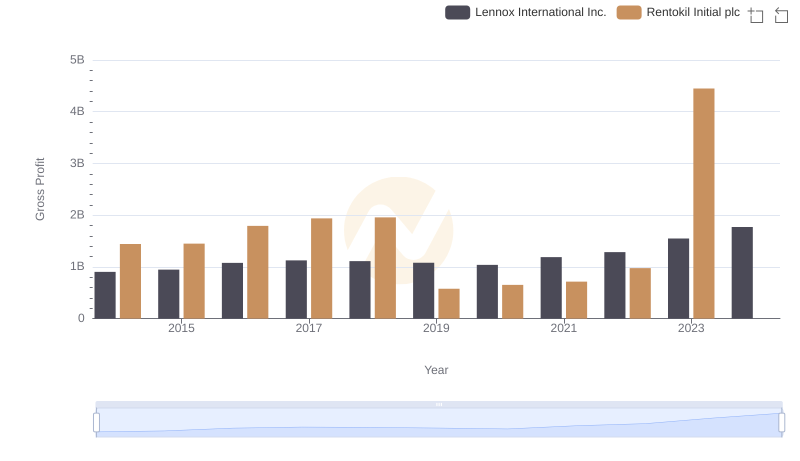
Gross Profit Comparison: Lennox International Inc. and Rentokil Initial plc Trends
Gross Profit Trends Compared: Lennox International Inc. vs Nordson Corporation
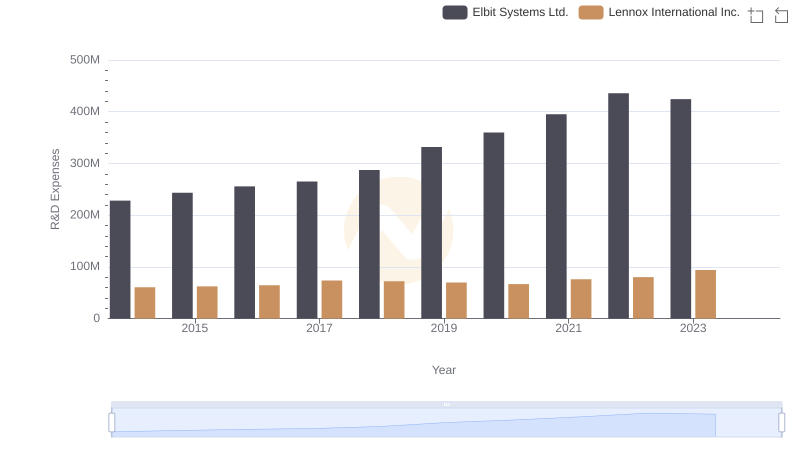
Lennox International Inc. vs Elbit Systems Ltd.: Strategic Focus on R&D Spending
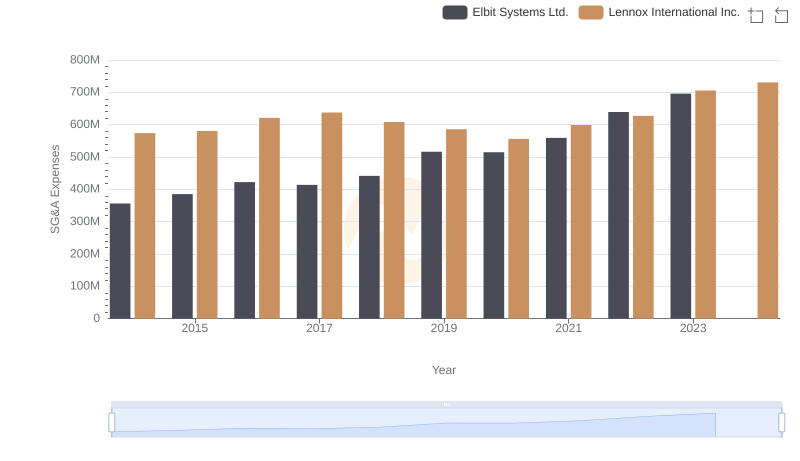
Comparing SG&A Expenses: Lennox International Inc. vs Elbit Systems Ltd. Trends and Insights
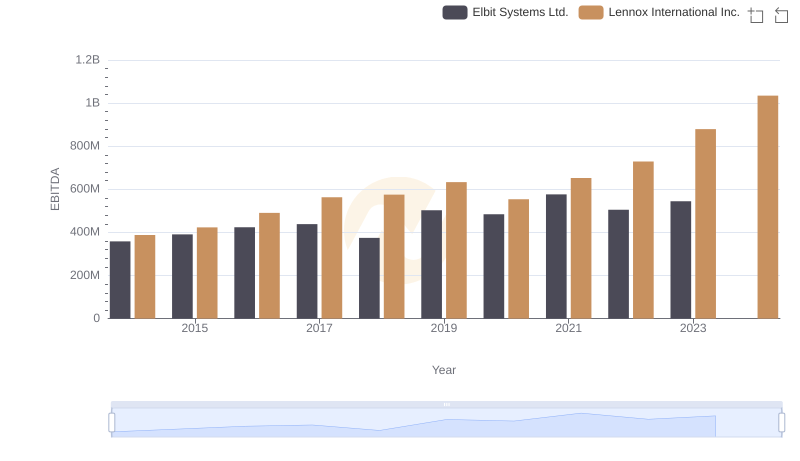
Professional EBITDA Benchmarking: Lennox International Inc. vs Elbit Systems Ltd.