| __timestamp | Curtiss-Wright Corporation | Lennox International Inc. |
|---|---|---|
| Wednesday, January 1, 2014 | 776516000 | 903300000 |
| Thursday, January 1, 2015 | 783255000 | 947400000 |
| Friday, January 1, 2016 | 750483000 | 1076500000 |
| Sunday, January 1, 2017 | 818595000 | 1125200000 |
| Monday, January 1, 2018 | 871261000 | 1111200000 |
| Tuesday, January 1, 2019 | 898745000 | 1079800000 |
| Wednesday, January 1, 2020 | 841227000 | 1040100000 |
| Friday, January 1, 2021 | 933356000 | 1188400000 |
| Saturday, January 1, 2022 | 954609000 | 1284700000 |
| Sunday, January 1, 2023 | 1067178000 | 1547800000 |
| Monday, January 1, 2024 | 1153549000 | 1771900000 |
Unleashing the power of data
In the competitive landscape of industrial manufacturing, Lennox International Inc. and Curtiss-Wright Corporation have showcased intriguing gross profit trends over the past decade. From 2014 to 2023, Lennox International Inc. has consistently outperformed Curtiss-Wright Corporation, with a notable 71% increase in gross profit, peaking at approximately $1.55 billion in 2023. In contrast, Curtiss-Wright Corporation experienced a steady growth of around 37%, reaching its highest gross profit of about $1.07 billion in the same year.
The data reveals a significant divergence in 2016, where Lennox's gross profit surged by 14% compared to the previous year, while Curtiss-Wright saw a decline. This trend continued, with Lennox maintaining a robust upward trajectory, culminating in a remarkable 21% increase from 2022 to 2023. As we look to the future, Lennox's projected figures for 2024 suggest continued growth, while Curtiss-Wright's data remains incomplete, leaving room for speculation.
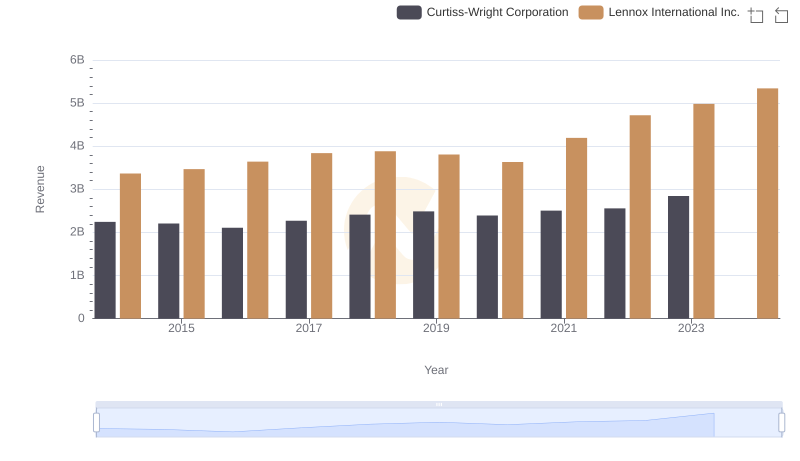
Revenue Showdown: Lennox International Inc. vs Curtiss-Wright Corporation
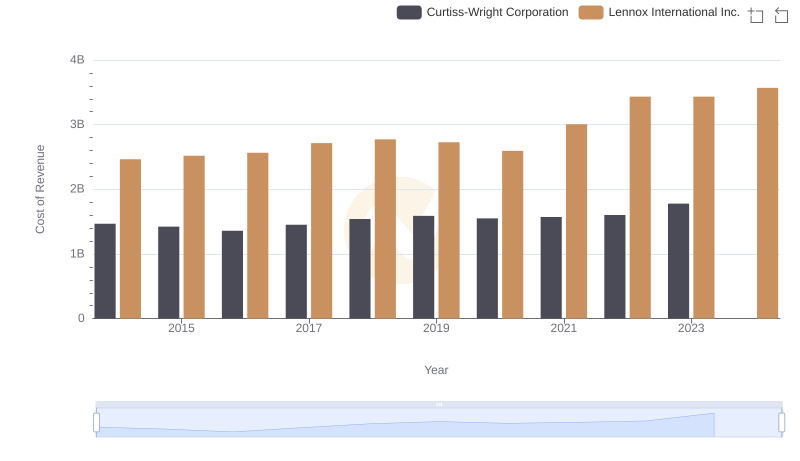
Cost of Revenue Comparison: Lennox International Inc. vs Curtiss-Wright Corporation
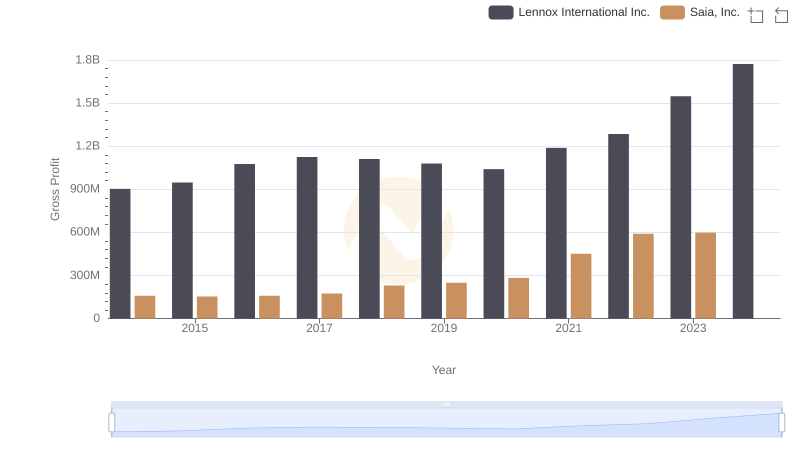
Gross Profit Trends Compared: Lennox International Inc. vs Saia, Inc.
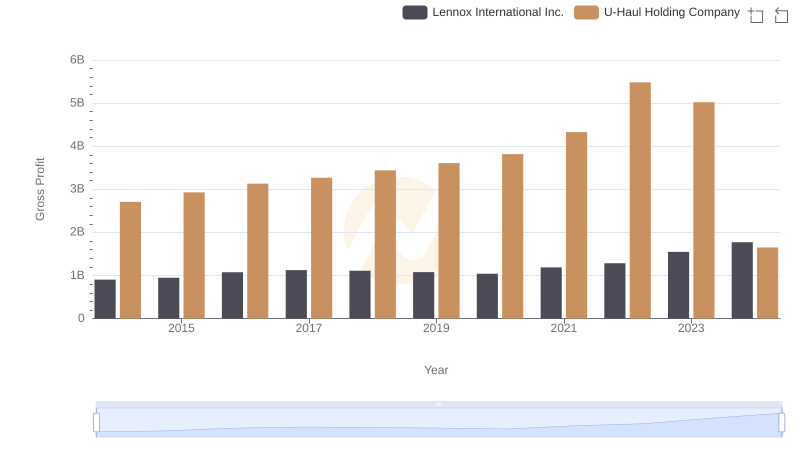
Lennox International Inc. vs U-Haul Holding Company: A Gross Profit Performance Breakdown
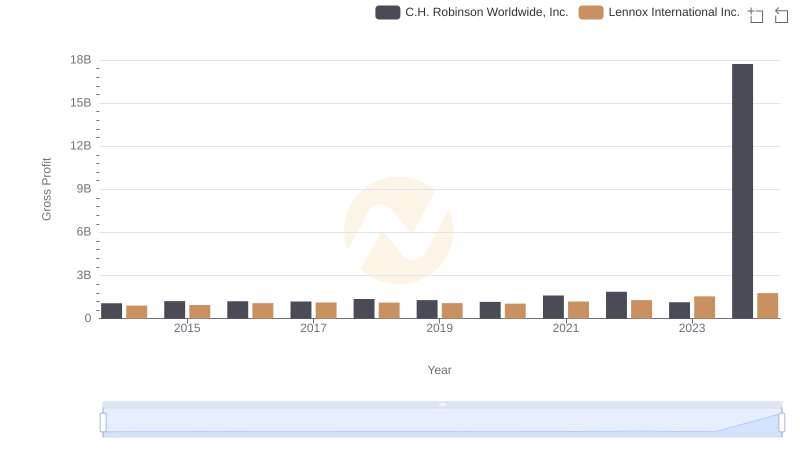
Gross Profit Analysis: Comparing Lennox International Inc. and C.H. Robinson Worldwide, Inc.
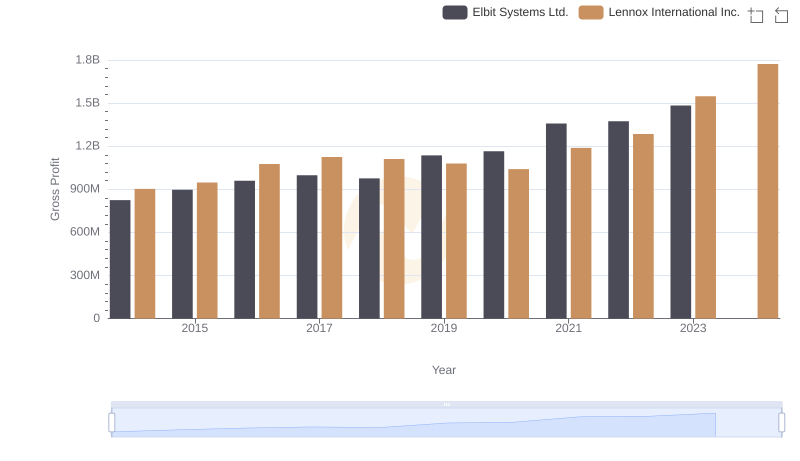
Gross Profit Comparison: Lennox International Inc. and Elbit Systems Ltd. Trends
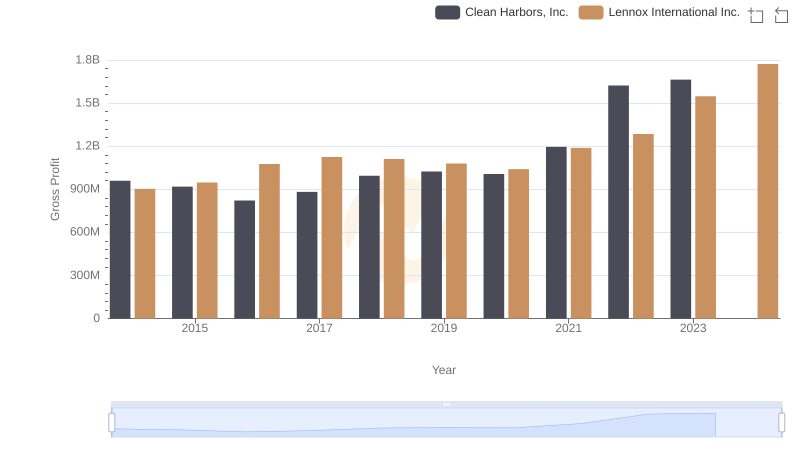
Gross Profit Trends Compared: Lennox International Inc. vs Clean Harbors, Inc.
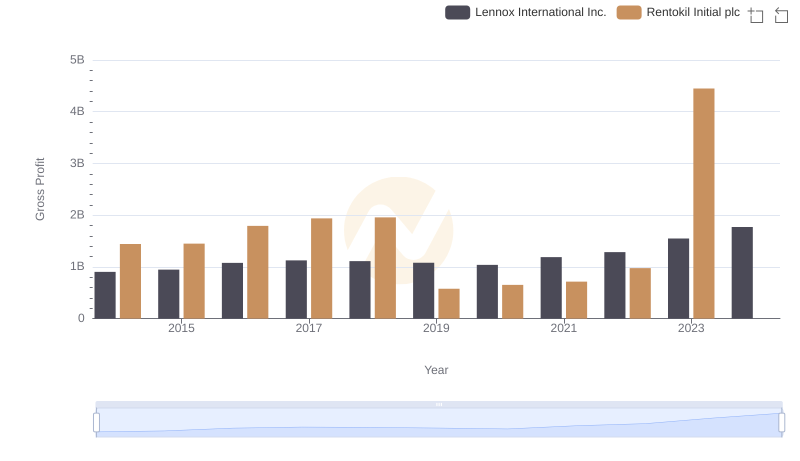
Gross Profit Comparison: Lennox International Inc. and Rentokil Initial plc Trends
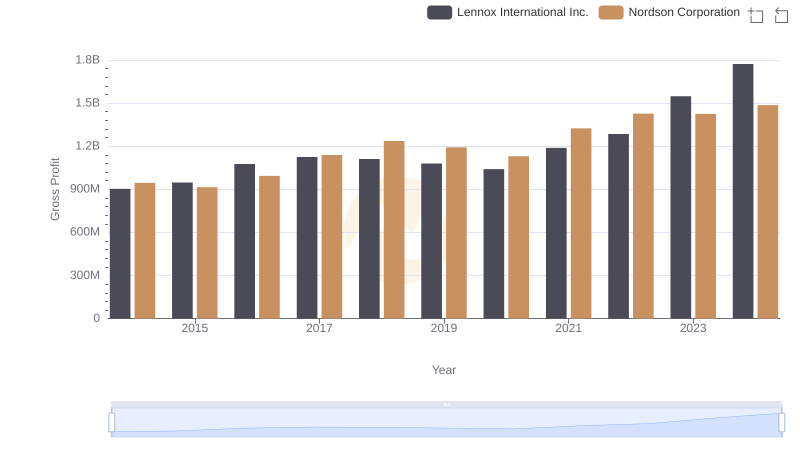
Gross Profit Trends Compared: Lennox International Inc. vs Nordson Corporation
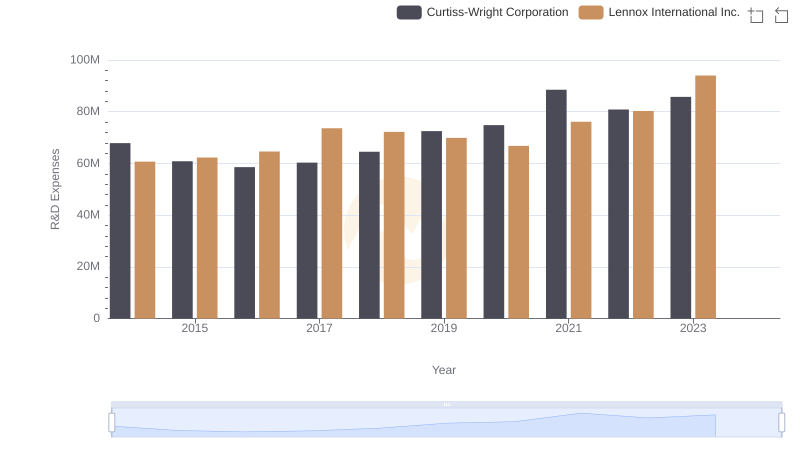
Research and Development Investment: Lennox International Inc. vs Curtiss-Wright Corporation
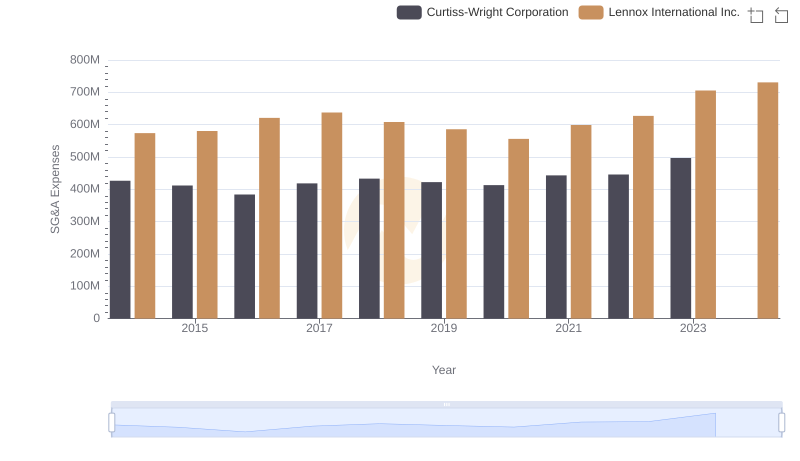
SG&A Efficiency Analysis: Comparing Lennox International Inc. and Curtiss-Wright Corporation

Professional EBITDA Benchmarking: Lennox International Inc. vs Curtiss-Wright Corporation