| __timestamp | Clean Harbors, Inc. | Lennox International Inc. |
|---|---|---|
| Wednesday, January 1, 2014 | 959840000 | 903300000 |
| Thursday, January 1, 2015 | 918331000 | 947400000 |
| Friday, January 1, 2016 | 822369000 | 1076500000 |
| Sunday, January 1, 2017 | 882305000 | 1125200000 |
| Monday, January 1, 2018 | 994752000 | 1111200000 |
| Tuesday, January 1, 2019 | 1024371000 | 1079800000 |
| Wednesday, January 1, 2020 | 1006346000 | 1040100000 |
| Friday, January 1, 2021 | 1195729000 | 1188400000 |
| Saturday, January 1, 2022 | 1622675000 | 1284700000 |
| Sunday, January 1, 2023 | 1663028000 | 1547800000 |
| Monday, January 1, 2024 | 1824239000 | 1771900000 |
Unlocking the unknown
In the competitive landscape of industrial services and climate control, Clean Harbors, Inc. and Lennox International Inc. have shown intriguing gross profit trends over the past decade. From 2014 to 2023, Clean Harbors experienced a robust growth of approximately 73%, with a notable surge in 2022, reaching a peak gross profit of $1.66 billion in 2023. Meanwhile, Lennox International demonstrated a steady upward trajectory, culminating in a 71% increase over the same period, with a remarkable gross profit of $1.55 billion in 2023.
While both companies have shown resilience, Lennox International's consistent growth reflects its strategic market positioning in the HVAC industry. Clean Harbors, on the other hand, capitalized on environmental services demand, especially post-2020. The data for 2024 is incomplete, but the trends suggest continued growth for Lennox International.
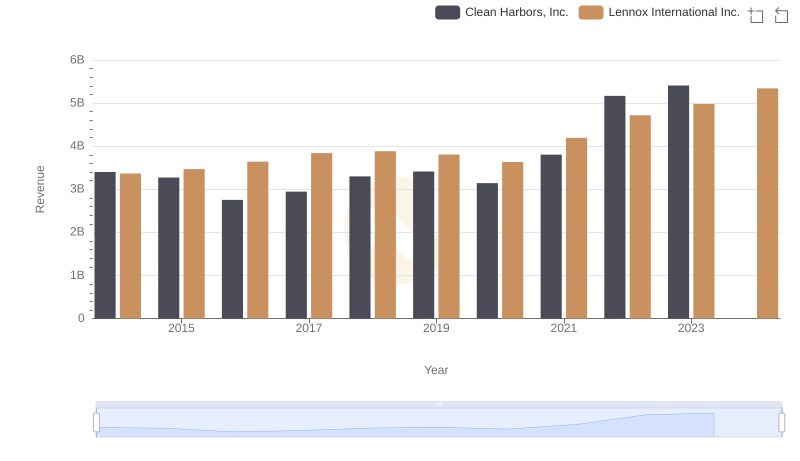
Comparing Revenue Performance: Lennox International Inc. or Clean Harbors, Inc.?
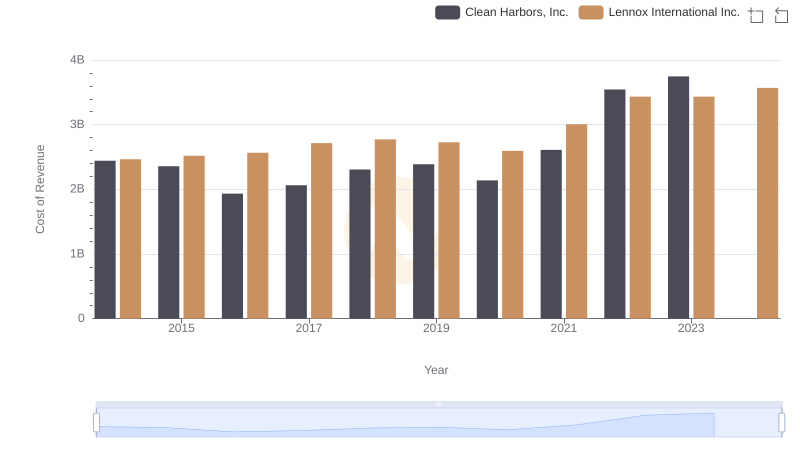
Cost of Revenue Comparison: Lennox International Inc. vs Clean Harbors, Inc.
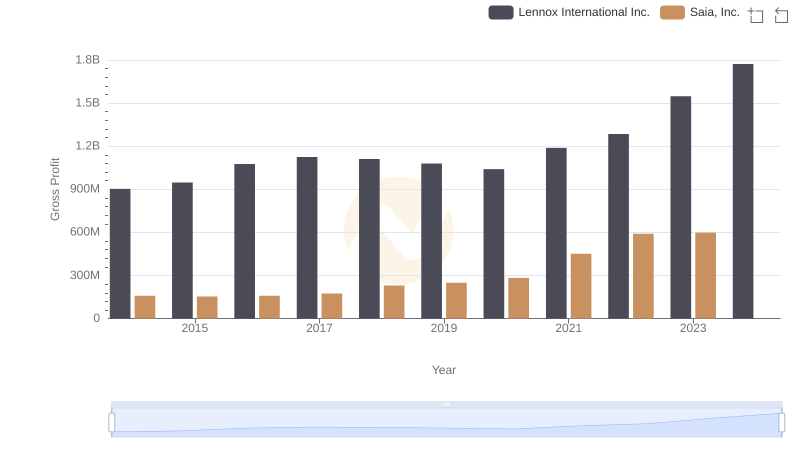
Gross Profit Trends Compared: Lennox International Inc. vs Saia, Inc.
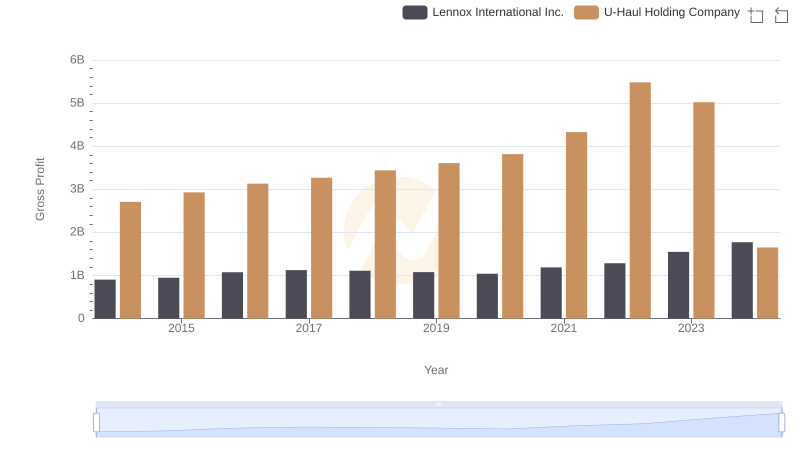
Lennox International Inc. vs U-Haul Holding Company: A Gross Profit Performance Breakdown
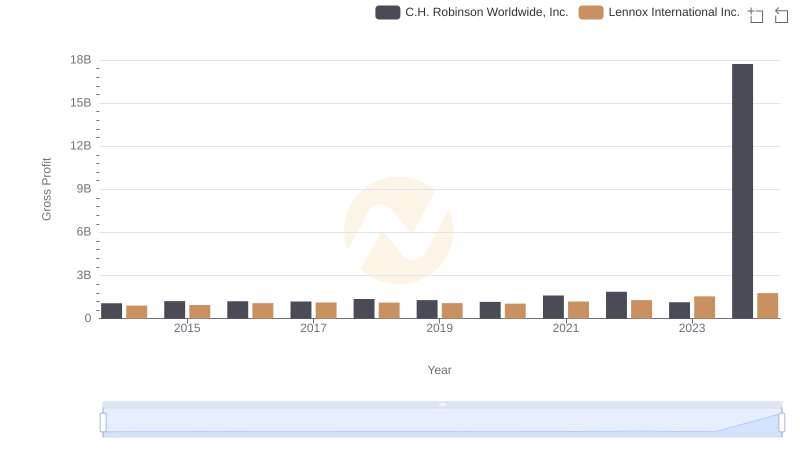
Gross Profit Analysis: Comparing Lennox International Inc. and C.H. Robinson Worldwide, Inc.
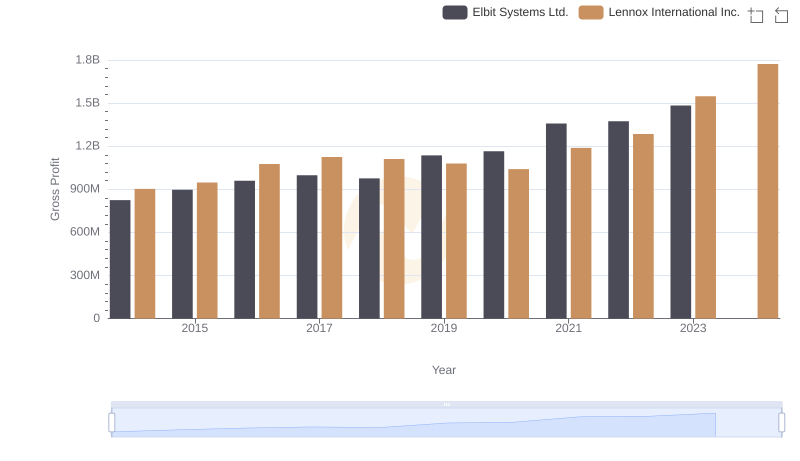
Gross Profit Comparison: Lennox International Inc. and Elbit Systems Ltd. Trends
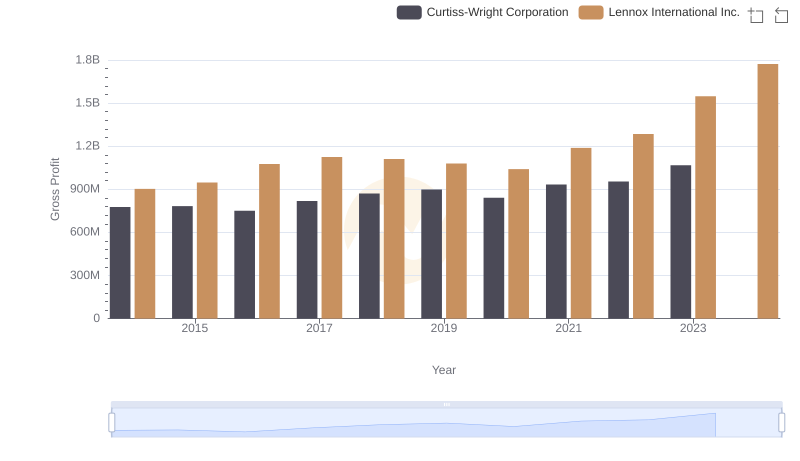
Gross Profit Trends Compared: Lennox International Inc. vs Curtiss-Wright Corporation
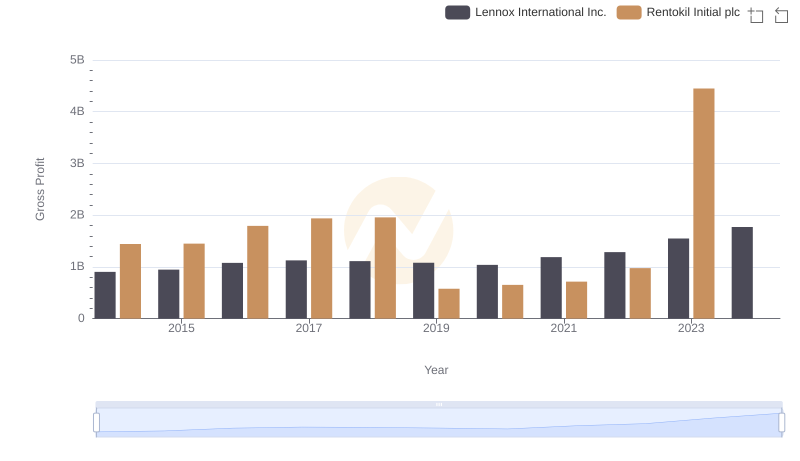
Gross Profit Comparison: Lennox International Inc. and Rentokil Initial plc Trends
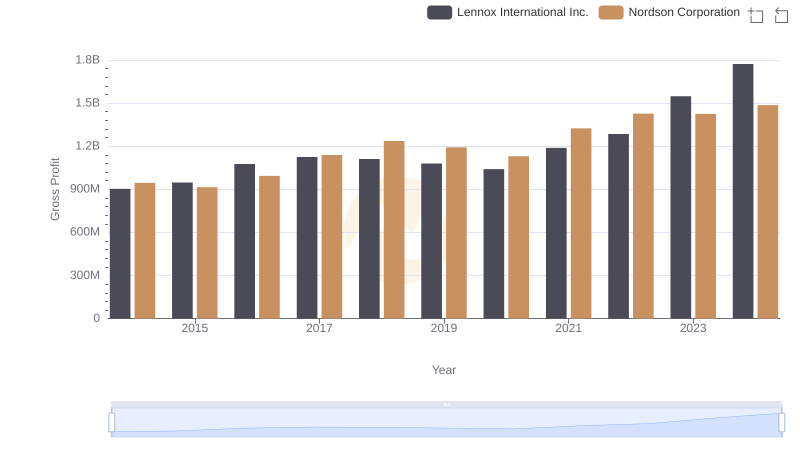
Gross Profit Trends Compared: Lennox International Inc. vs Nordson Corporation
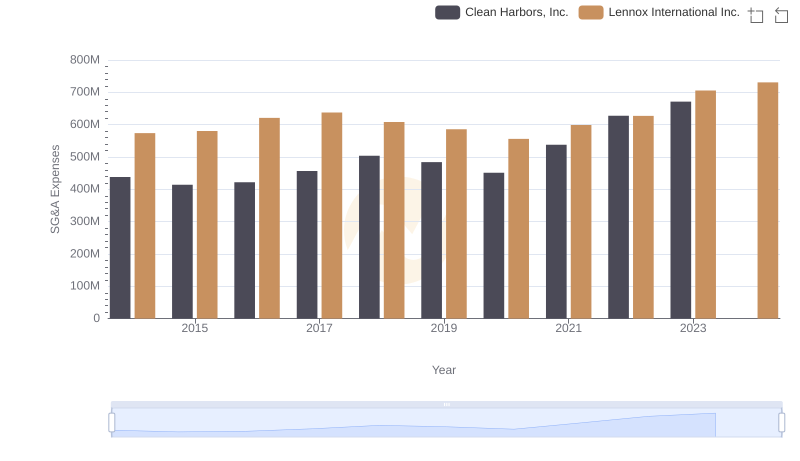
Lennox International Inc. and Clean Harbors, Inc.: SG&A Spending Patterns Compared
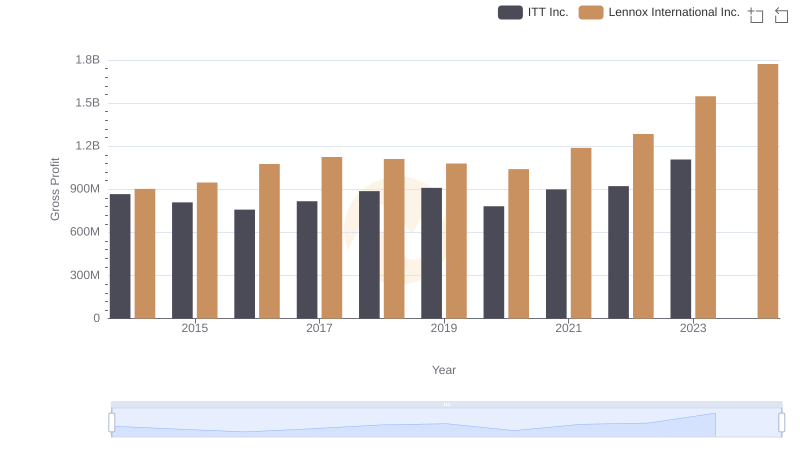
Gross Profit Trends Compared: Lennox International Inc. vs ITT Inc.
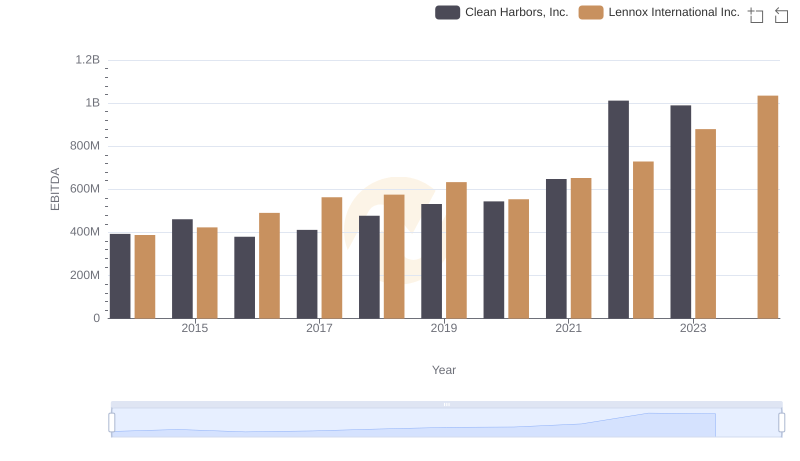
Comparative EBITDA Analysis: Lennox International Inc. vs Clean Harbors, Inc.