| __timestamp | Lennox International Inc. | Rentokil Initial plc |
|---|---|---|
| Wednesday, January 1, 2014 | 903300000 | 1443300000 |
| Thursday, January 1, 2015 | 947400000 | 1448800000 |
| Friday, January 1, 2016 | 1076500000 | 1792000000 |
| Sunday, January 1, 2017 | 1125200000 | 1937400000 |
| Monday, January 1, 2018 | 1111200000 | 1958100000 |
| Tuesday, January 1, 2019 | 1079800000 | 577200000 |
| Wednesday, January 1, 2020 | 1040100000 | 653000000 |
| Friday, January 1, 2021 | 1188400000 | 714800000 |
| Saturday, January 1, 2022 | 1284700000 | 977000000 |
| Sunday, January 1, 2023 | 1547800000 | 4448000000 |
| Monday, January 1, 2024 | 1771900000 |
Unleashing insights
In the ever-evolving landscape of global business, Lennox International Inc. and Rentokil Initial plc stand as titans in their respective industries. Over the past decade, these companies have showcased remarkable growth in gross profit, reflecting their strategic prowess and market adaptability.
From 2014 to 2023, Lennox International Inc. experienced a steady increase in gross profit, culminating in a 96% rise by 2023. This growth trajectory highlights their robust operational strategies and market expansion efforts. Meanwhile, Rentokil Initial plc demonstrated a more volatile pattern, with a significant spike in 2023, marking a 208% increase from their 2014 figures. This surge underscores their aggressive acquisition strategy and expansion into new markets.
While Lennox's growth was consistent, Rentokil's dramatic rise in 2023 suggests a strategic pivot that could redefine their market position. However, data for 2024 remains incomplete, leaving room for speculation on future trends.
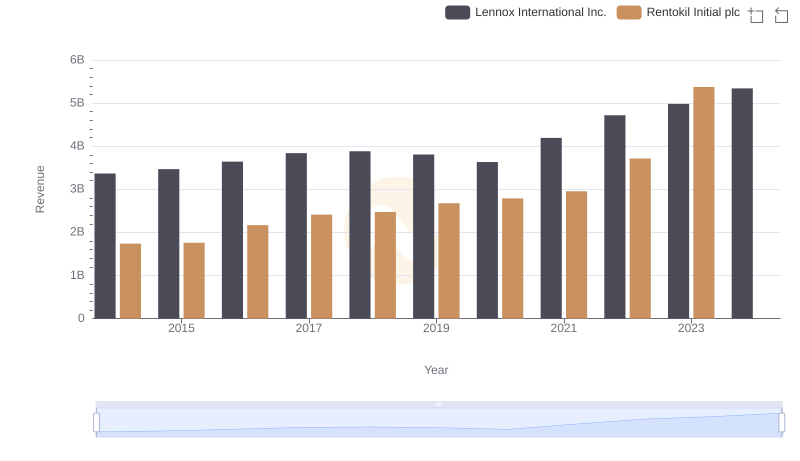
Annual Revenue Comparison: Lennox International Inc. vs Rentokil Initial plc
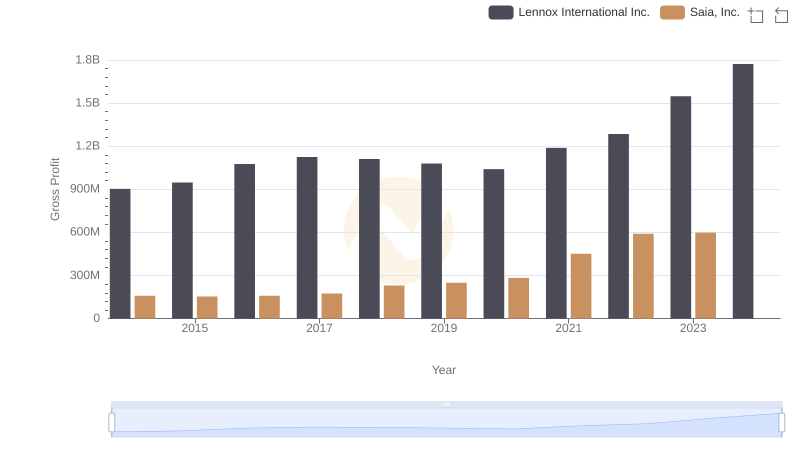
Gross Profit Trends Compared: Lennox International Inc. vs Saia, Inc.
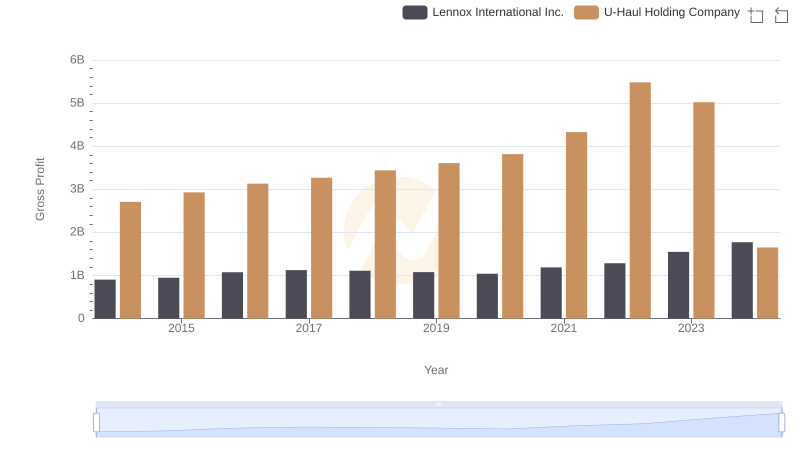
Lennox International Inc. vs U-Haul Holding Company: A Gross Profit Performance Breakdown
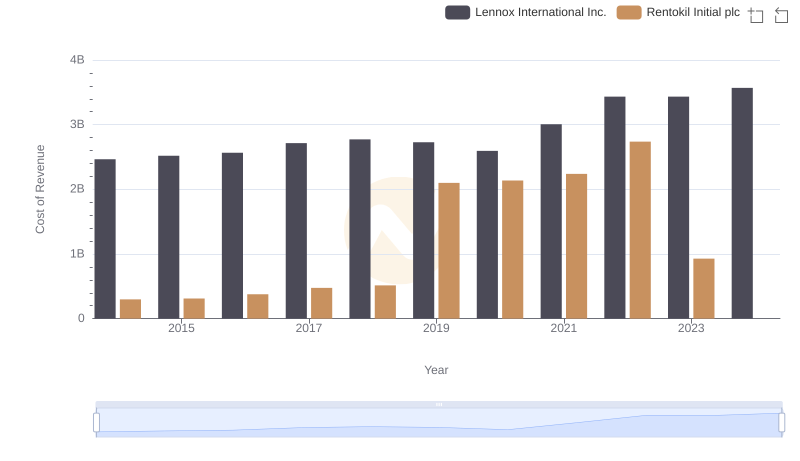
Cost Insights: Breaking Down Lennox International Inc. and Rentokil Initial plc's Expenses
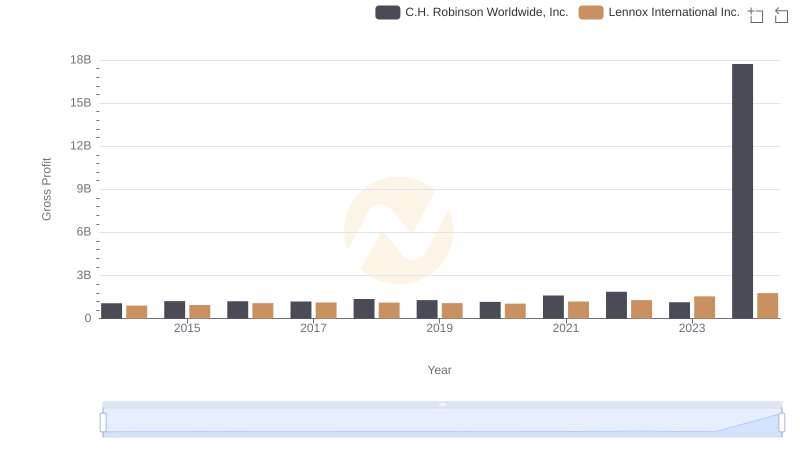
Gross Profit Analysis: Comparing Lennox International Inc. and C.H. Robinson Worldwide, Inc.
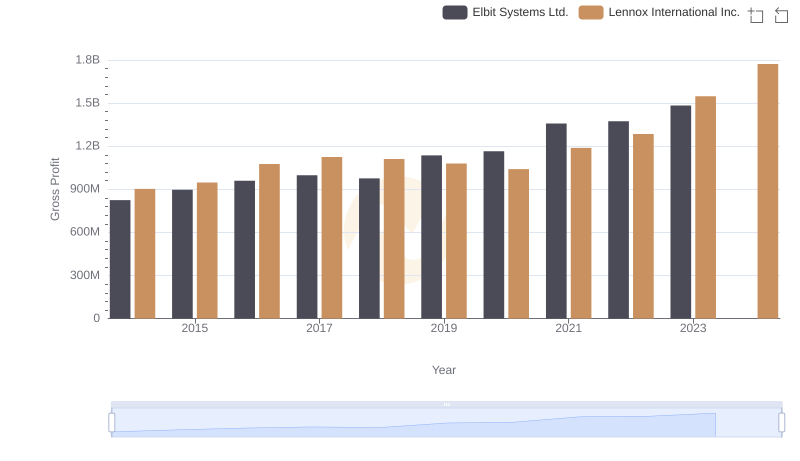
Gross Profit Comparison: Lennox International Inc. and Elbit Systems Ltd. Trends
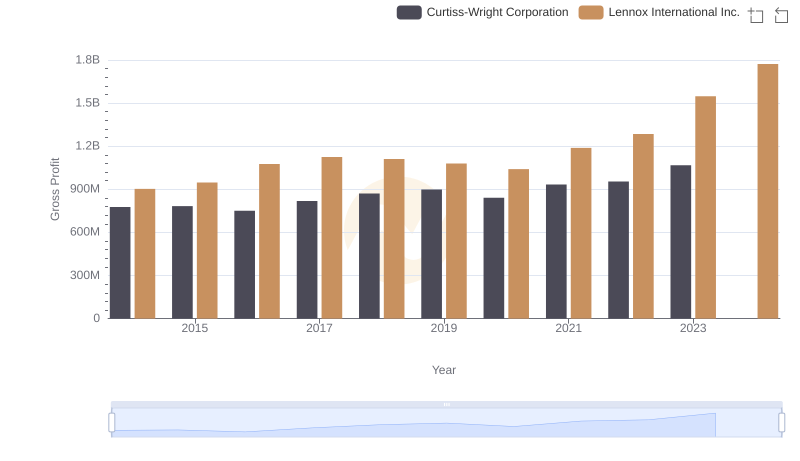
Gross Profit Trends Compared: Lennox International Inc. vs Curtiss-Wright Corporation
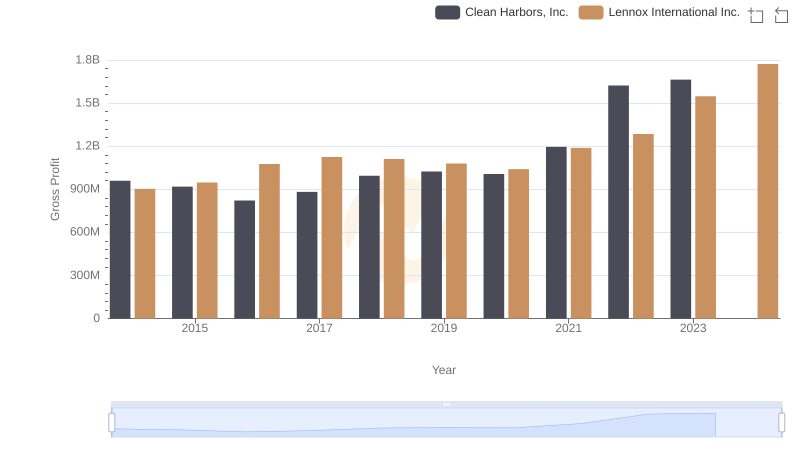
Gross Profit Trends Compared: Lennox International Inc. vs Clean Harbors, Inc.
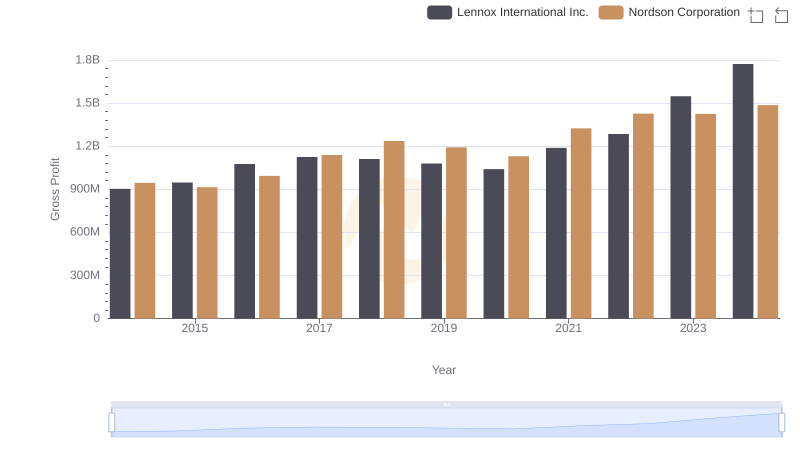
Gross Profit Trends Compared: Lennox International Inc. vs Nordson Corporation
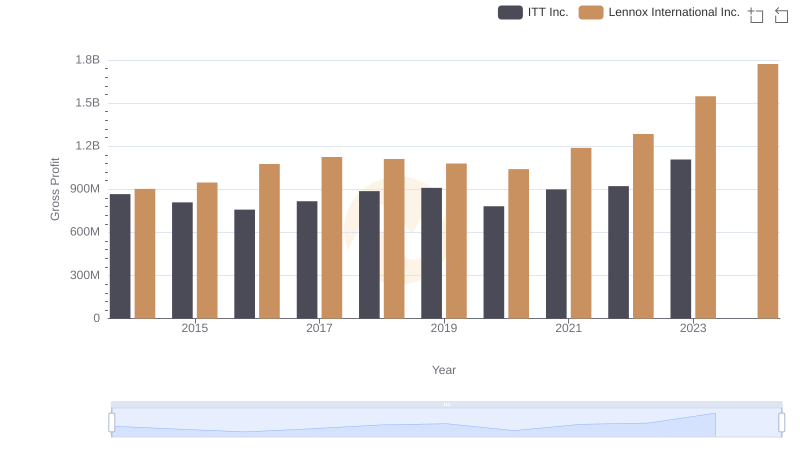
Gross Profit Trends Compared: Lennox International Inc. vs ITT Inc.
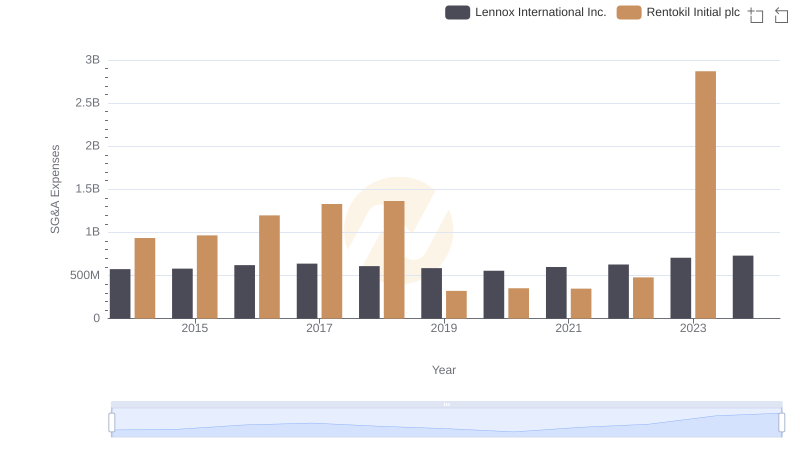
Who Optimizes SG&A Costs Better? Lennox International Inc. or Rentokil Initial plc
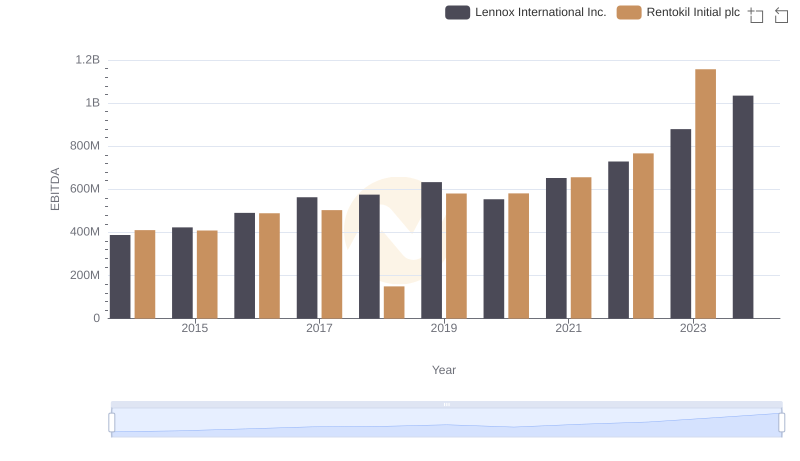
Lennox International Inc. vs Rentokil Initial plc: In-Depth EBITDA Performance Comparison