| __timestamp | Curtiss-Wright Corporation | Lennox International Inc. |
|---|---|---|
| Wednesday, January 1, 2014 | 1466610000 | 2464100000 |
| Thursday, January 1, 2015 | 1422428000 | 2520000000 |
| Friday, January 1, 2016 | 1358448000 | 2565100000 |
| Sunday, January 1, 2017 | 1452431000 | 2714400000 |
| Monday, January 1, 2018 | 1540574000 | 2772700000 |
| Tuesday, January 1, 2019 | 1589216000 | 2727400000 |
| Wednesday, January 1, 2020 | 1550109000 | 2594000000 |
| Friday, January 1, 2021 | 1572575000 | 3005700000 |
| Saturday, January 1, 2022 | 1602416000 | 3433700000 |
| Sunday, January 1, 2023 | 1778195000 | 3434100000 |
| Monday, January 1, 2024 | 1967640000 | 3569400000 |
In pursuit of knowledge
In the competitive landscape of industrial manufacturing, Lennox International Inc. and Curtiss-Wright Corporation have been pivotal players. Over the past decade, Lennox International has consistently outpaced Curtiss-Wright in terms of cost of revenue, with a notable 20% higher average. From 2014 to 2023, Lennox's cost of revenue surged by approximately 40%, peaking in 2023. In contrast, Curtiss-Wright's growth was more modest, with a 21% increase over the same period. The year 2023 marked a significant milestone for both companies, with Lennox reaching its highest recorded cost of revenue, while Curtiss-Wright experienced a substantial jump of 11% from the previous year. However, data for 2024 is incomplete, leaving room for speculation on future trends. This comparison not only highlights the financial strategies of these industrial titans but also provides insights into their operational efficiencies and market positioning.
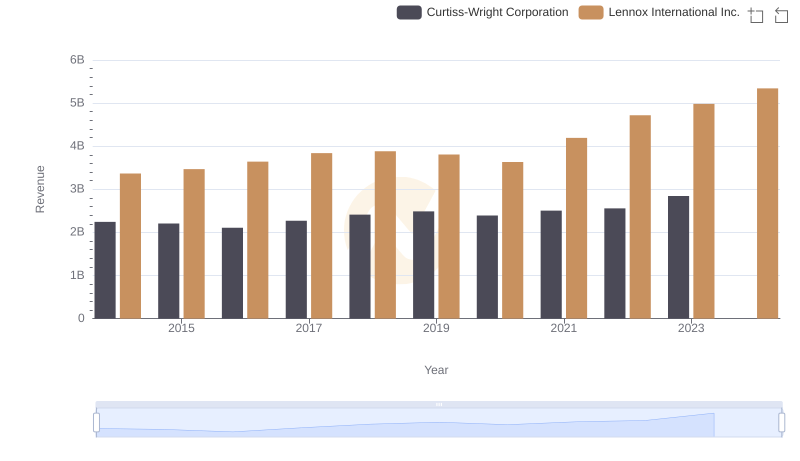
Revenue Showdown: Lennox International Inc. vs Curtiss-Wright Corporation
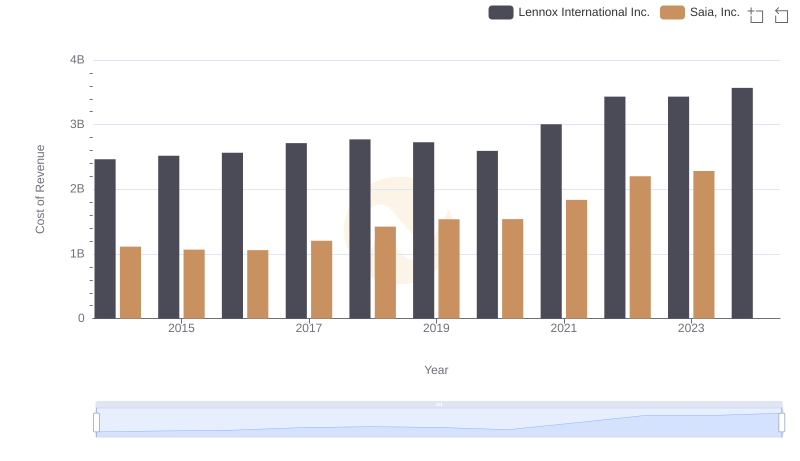
Cost Insights: Breaking Down Lennox International Inc. and Saia, Inc.'s Expenses
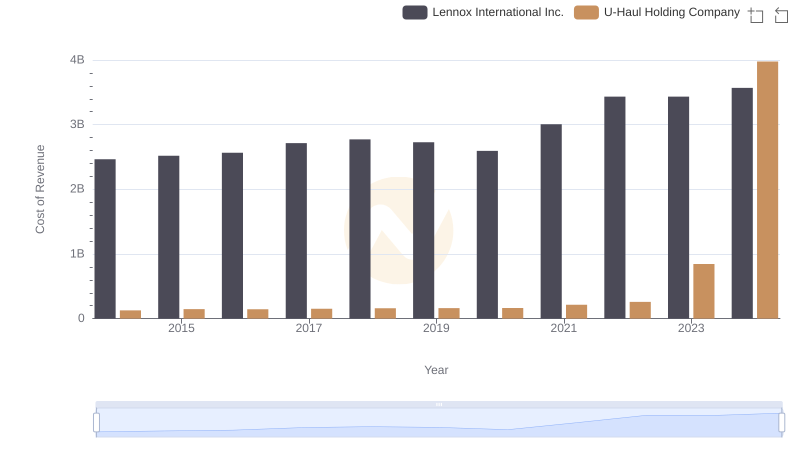
Cost Insights: Breaking Down Lennox International Inc. and U-Haul Holding Company's Expenses
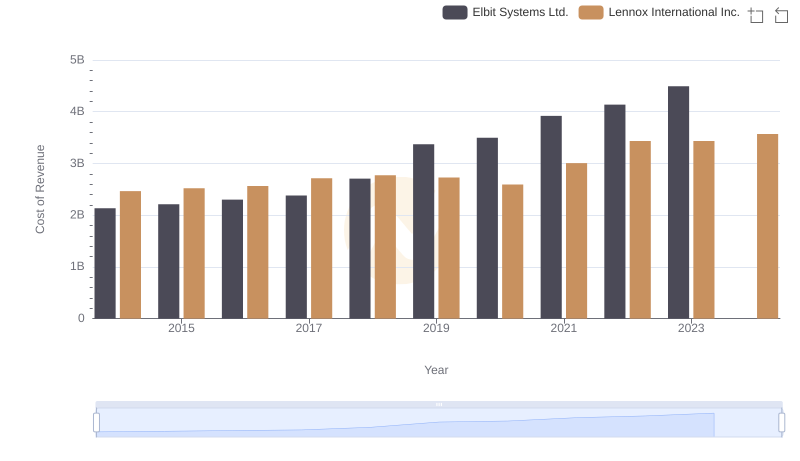
Cost of Revenue: Key Insights for Lennox International Inc. and Elbit Systems Ltd.
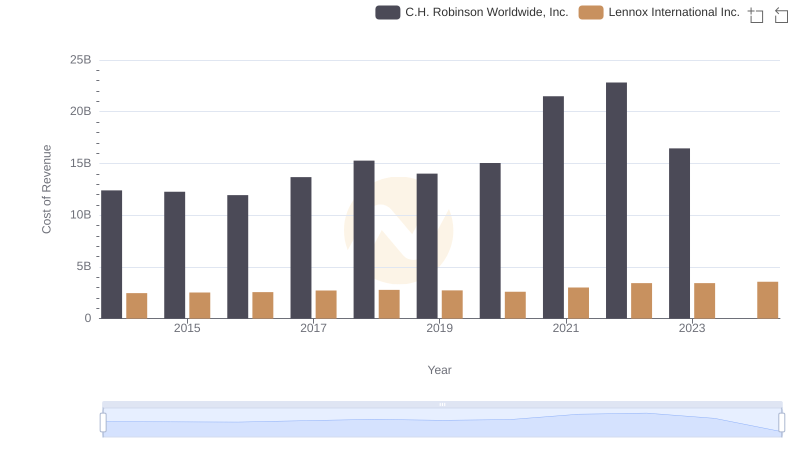
Cost of Revenue: Key Insights for Lennox International Inc. and C.H. Robinson Worldwide, Inc.
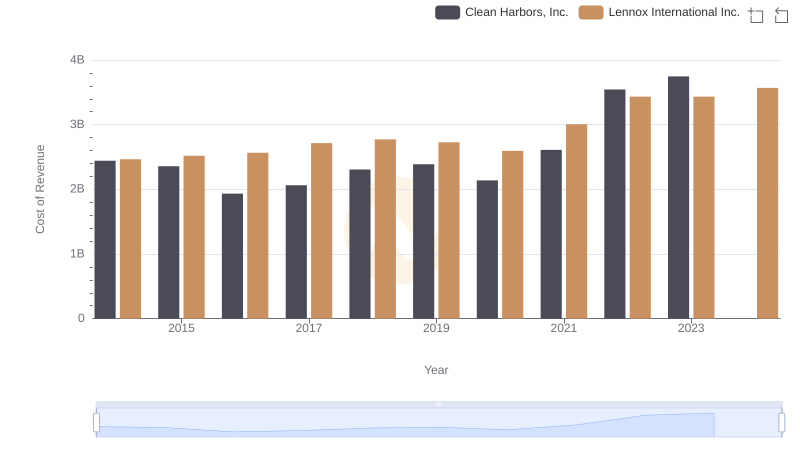
Cost of Revenue Comparison: Lennox International Inc. vs Clean Harbors, Inc.
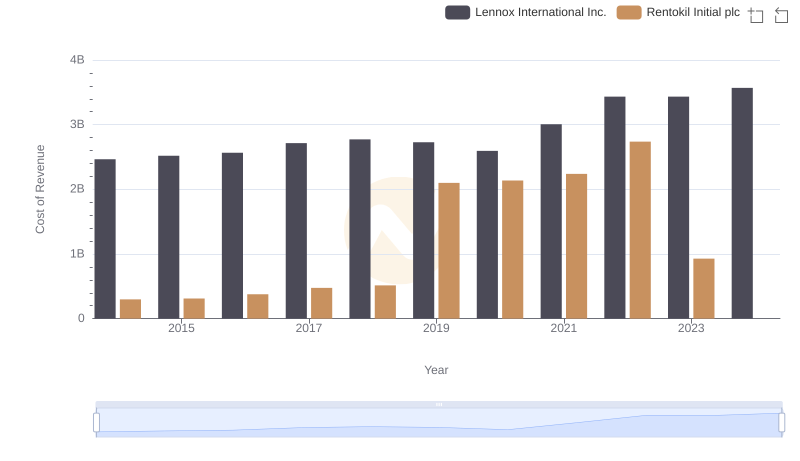
Cost Insights: Breaking Down Lennox International Inc. and Rentokil Initial plc's Expenses
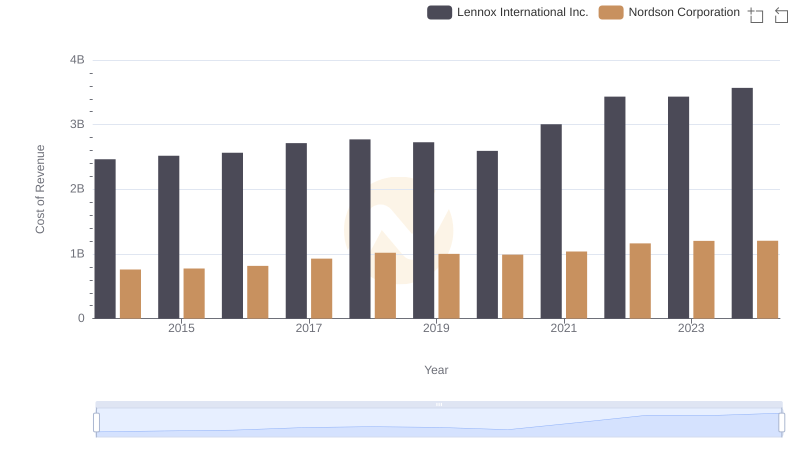
Cost of Revenue: Key Insights for Lennox International Inc. and Nordson Corporation
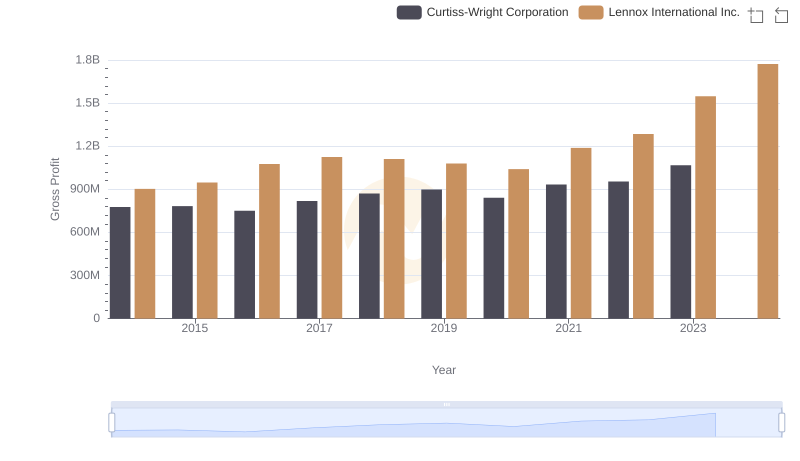
Gross Profit Trends Compared: Lennox International Inc. vs Curtiss-Wright Corporation
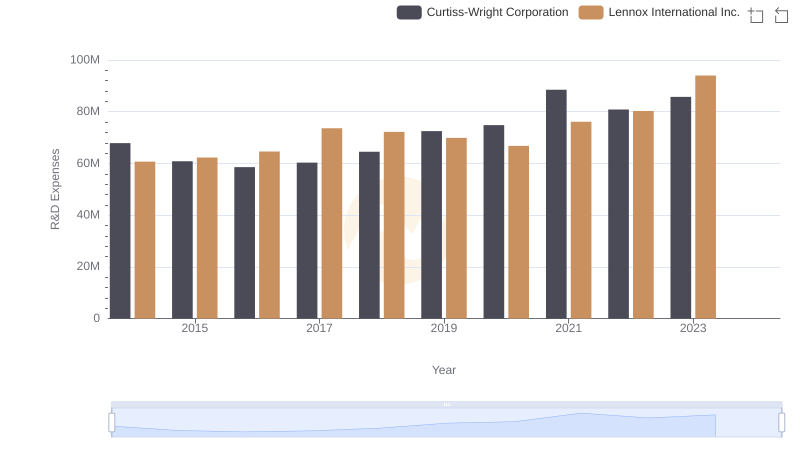
Research and Development Investment: Lennox International Inc. vs Curtiss-Wright Corporation
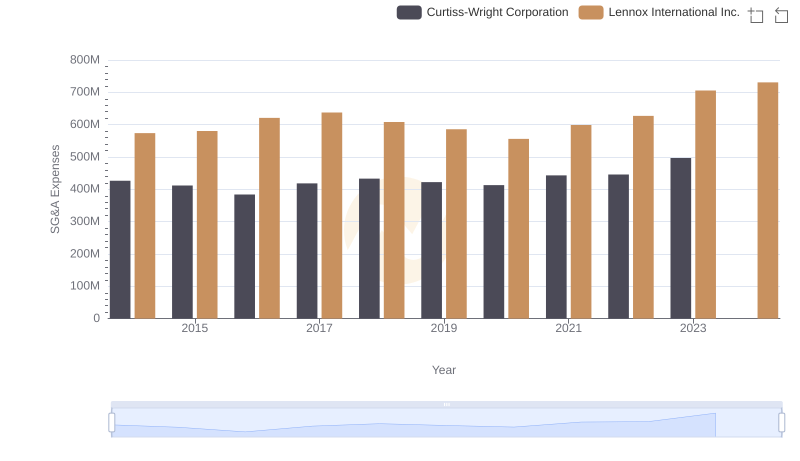
SG&A Efficiency Analysis: Comparing Lennox International Inc. and Curtiss-Wright Corporation

Professional EBITDA Benchmarking: Lennox International Inc. vs Curtiss-Wright Corporation