| __timestamp | Curtiss-Wright Corporation | Lennox International Inc. |
|---|---|---|
| Wednesday, January 1, 2014 | 2243126000 | 3367400000 |
| Thursday, January 1, 2015 | 2205683000 | 3467400000 |
| Friday, January 1, 2016 | 2108931000 | 3641600000 |
| Sunday, January 1, 2017 | 2271026000 | 3839600000 |
| Monday, January 1, 2018 | 2411835000 | 3883900000 |
| Tuesday, January 1, 2019 | 2487961000 | 3807200000 |
| Wednesday, January 1, 2020 | 2391336000 | 3634100000 |
| Friday, January 1, 2021 | 2505931000 | 4194100000 |
| Saturday, January 1, 2022 | 2557025000 | 4718400000 |
| Sunday, January 1, 2023 | 2845373000 | 4981900000 |
| Monday, January 1, 2024 | 3121189000 | 5341300000 |
Unveiling the hidden dimensions of data
In the competitive landscape of industrial manufacturing, Lennox International Inc. and Curtiss-Wright Corporation have been key players. Over the past decade, Lennox International has consistently outperformed Curtiss-Wright in terms of revenue. From 2014 to 2023, Lennox's revenue surged by approximately 58%, reaching nearly $5 billion in 2023. In contrast, Curtiss-Wright's revenue grew by about 27% during the same period, peaking at around $2.8 billion.
Lennox's revenue growth was particularly notable in 2022 and 2023, with increases of 12% and 6% respectively. Meanwhile, Curtiss-Wright experienced a significant jump in 2023, with a 11% rise from the previous year. However, data for 2024 is missing for Curtiss-Wright, leaving a gap in the comparison. This revenue showdown highlights the dynamic nature of the industrial sector and the varying strategies of these two giants.
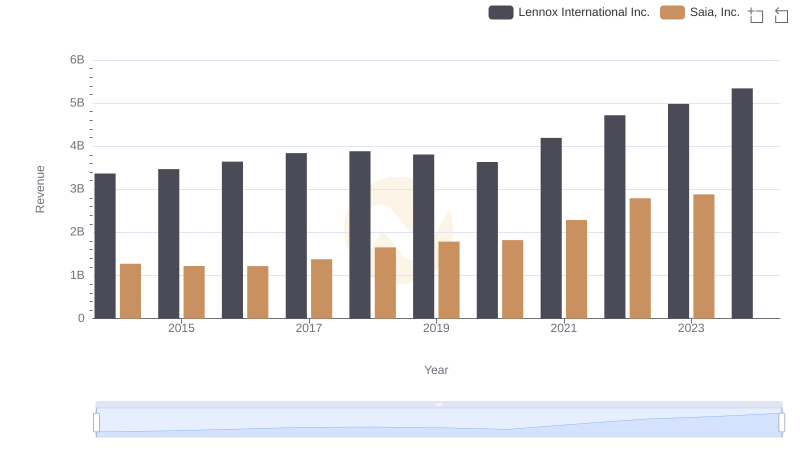
Revenue Insights: Lennox International Inc. and Saia, Inc. Performance Compared
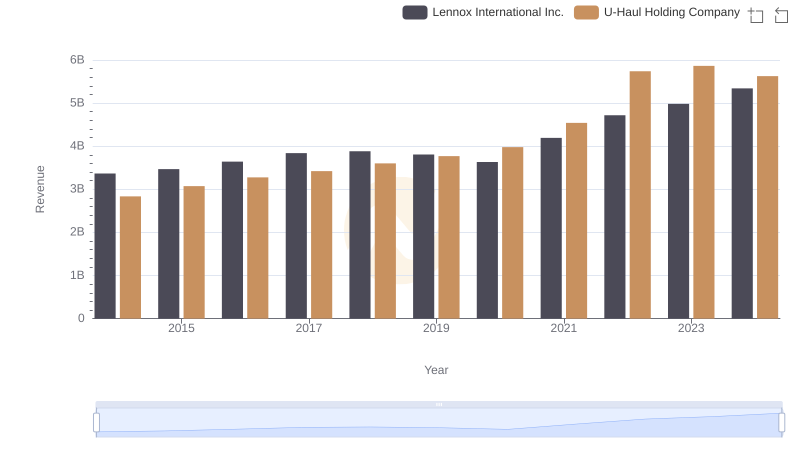
Lennox International Inc. and U-Haul Holding Company: A Comprehensive Revenue Analysis
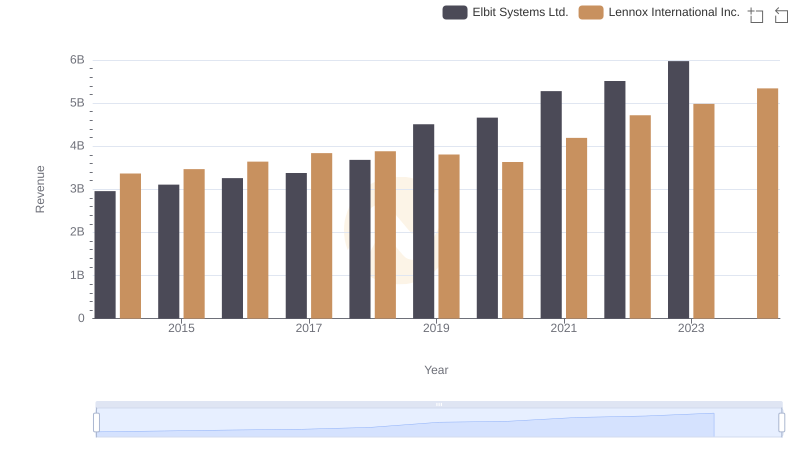
Lennox International Inc. or Elbit Systems Ltd.: Who Leads in Yearly Revenue?
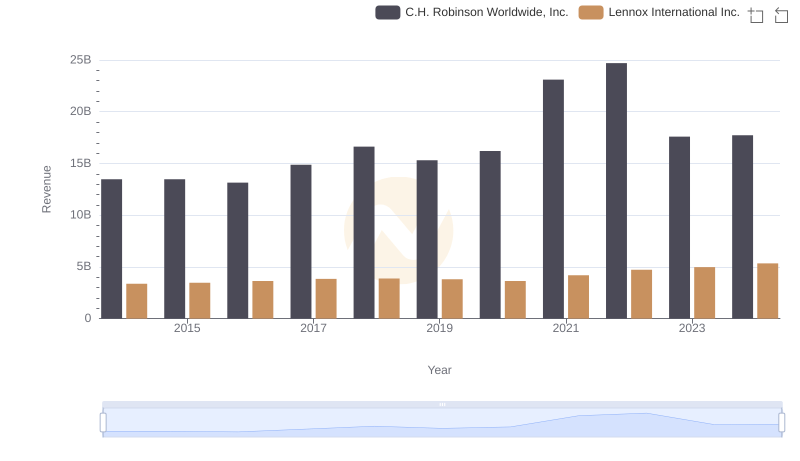
Revenue Showdown: Lennox International Inc. vs C.H. Robinson Worldwide, Inc.
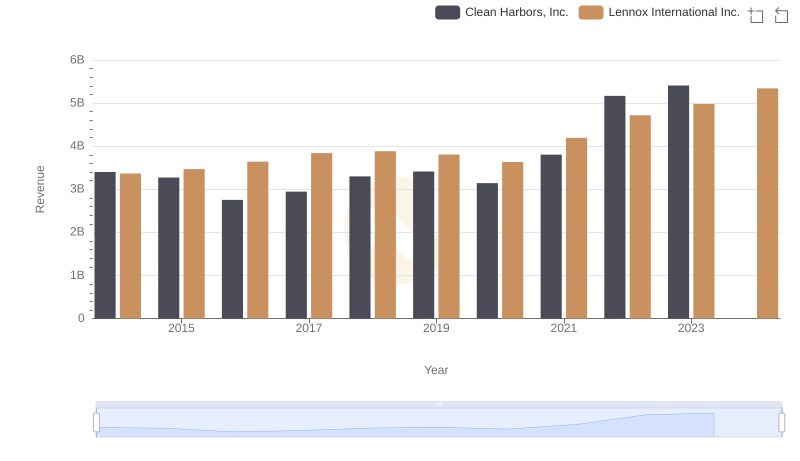
Comparing Revenue Performance: Lennox International Inc. or Clean Harbors, Inc.?
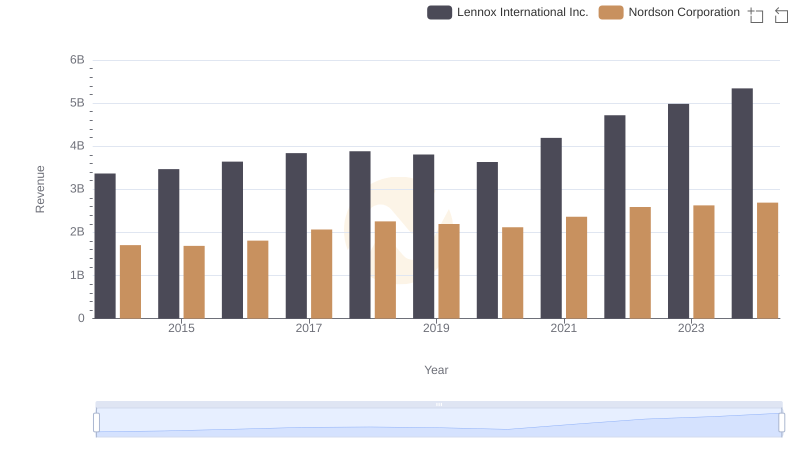
Revenue Showdown: Lennox International Inc. vs Nordson Corporation
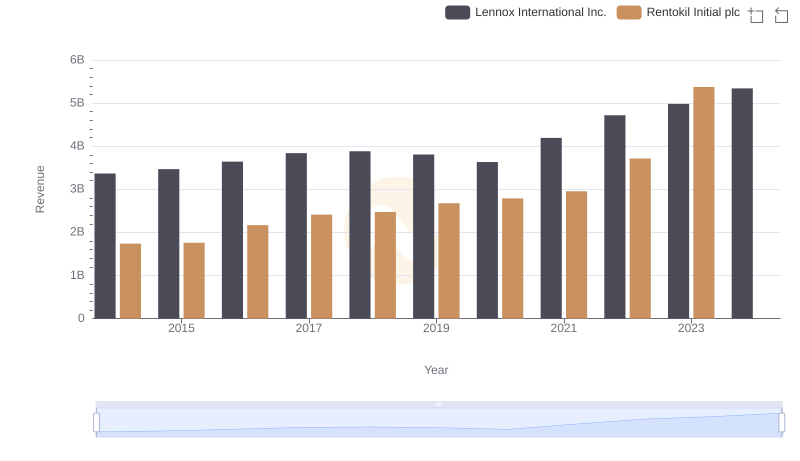
Annual Revenue Comparison: Lennox International Inc. vs Rentokil Initial plc
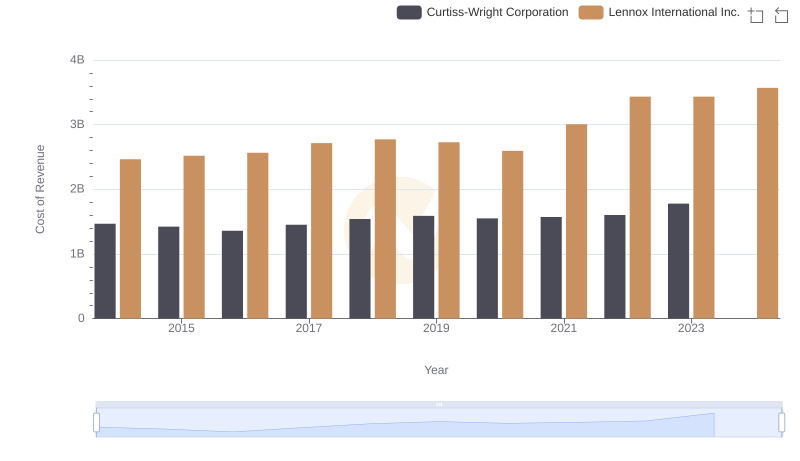
Cost of Revenue Comparison: Lennox International Inc. vs Curtiss-Wright Corporation
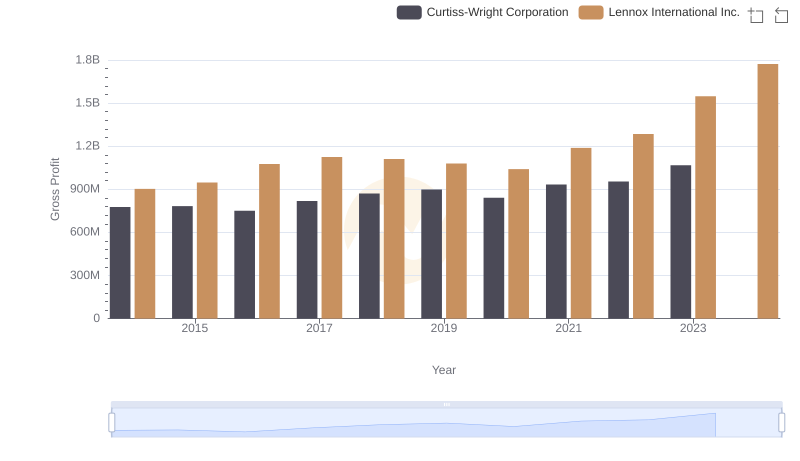
Gross Profit Trends Compared: Lennox International Inc. vs Curtiss-Wright Corporation
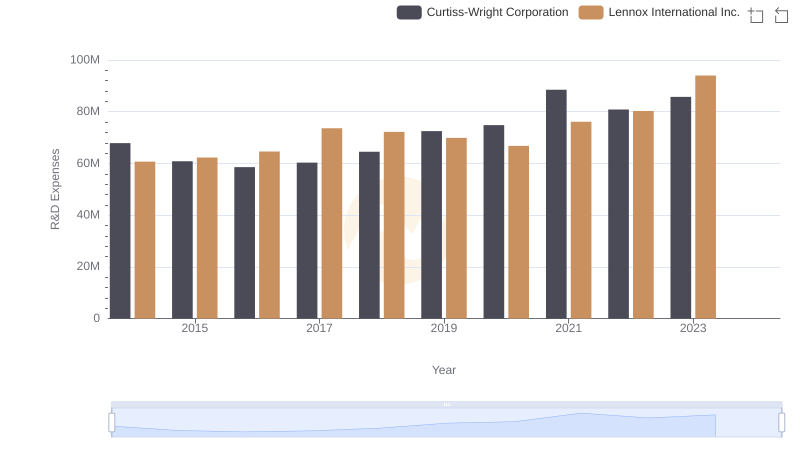
Research and Development Investment: Lennox International Inc. vs Curtiss-Wright Corporation
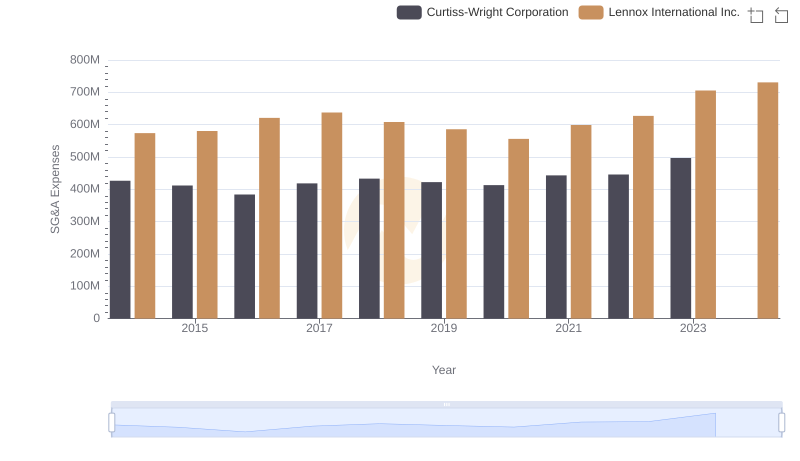
SG&A Efficiency Analysis: Comparing Lennox International Inc. and Curtiss-Wright Corporation

Professional EBITDA Benchmarking: Lennox International Inc. vs Curtiss-Wright Corporation