| __timestamp | Lennox International Inc. | Nordson Corporation |
|---|---|---|
| Wednesday, January 1, 2014 | 903300000 | 945098000 |
| Thursday, January 1, 2015 | 947400000 | 913964000 |
| Friday, January 1, 2016 | 1076500000 | 993499000 |
| Sunday, January 1, 2017 | 1125200000 | 1139001000 |
| Monday, January 1, 2018 | 1111200000 | 1235965000 |
| Tuesday, January 1, 2019 | 1079800000 | 1192103000 |
| Wednesday, January 1, 2020 | 1040100000 | 1130468000 |
| Friday, January 1, 2021 | 1188400000 | 1324080000 |
| Saturday, January 1, 2022 | 1284700000 | 1426536000 |
| Sunday, January 1, 2023 | 1547800000 | 1425405000 |
| Monday, January 1, 2024 | 1771900000 | 1486129000 |
In pursuit of knowledge
In the competitive landscape of industrial manufacturing, Lennox International Inc. and Nordson Corporation have shown remarkable growth in their gross profits over the past decade. From 2014 to 2024, Lennox International's gross profit surged by approximately 96%, while Nordson Corporation experienced a 57% increase. This trend highlights the resilience and strategic prowess of these companies in navigating market challenges.
Lennox International started with a gross profit of around $903 million in 2014, reaching an impressive $1.77 billion by 2024. Nordson Corporation, on the other hand, began with $945 million and climbed to $1.49 billion. Notably, Lennox's growth accelerated post-2020, reflecting a robust recovery and expansion strategy.
The data suggests that both companies have effectively leveraged their market positions, with Lennox showing a particularly aggressive growth trajectory in recent years. This analysis provides valuable insights for investors and industry analysts alike.
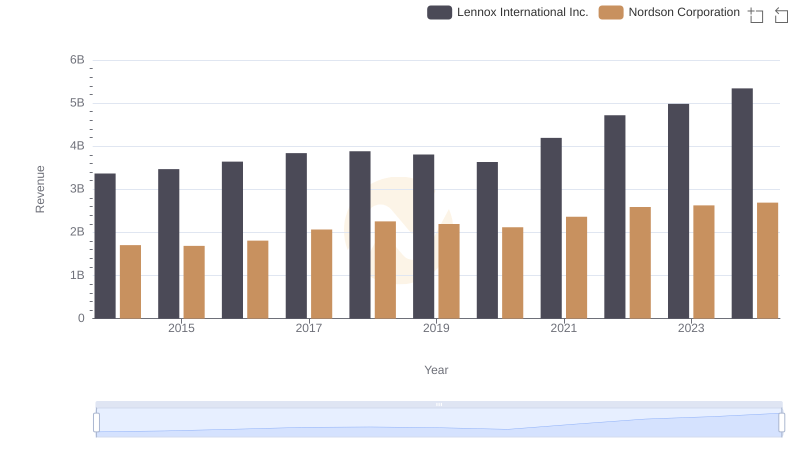
Revenue Showdown: Lennox International Inc. vs Nordson Corporation
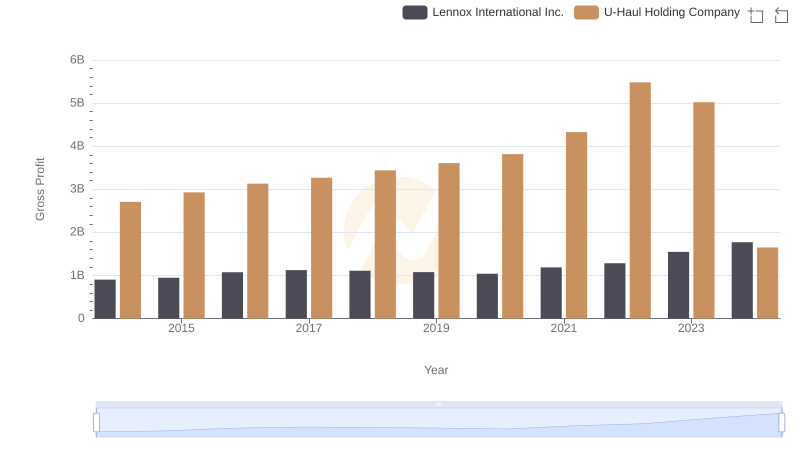
Lennox International Inc. vs U-Haul Holding Company: A Gross Profit Performance Breakdown
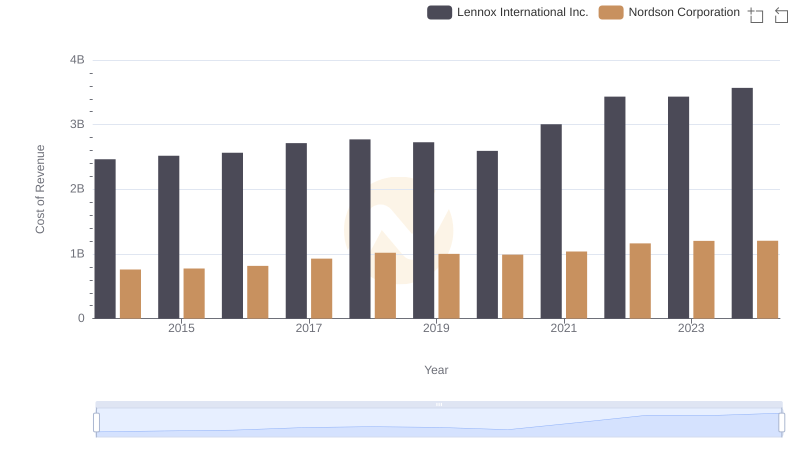
Cost of Revenue: Key Insights for Lennox International Inc. and Nordson Corporation
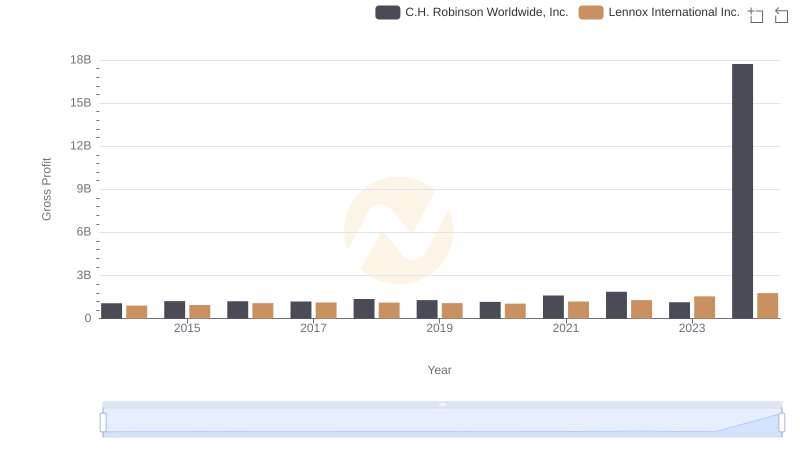
Gross Profit Analysis: Comparing Lennox International Inc. and C.H. Robinson Worldwide, Inc.
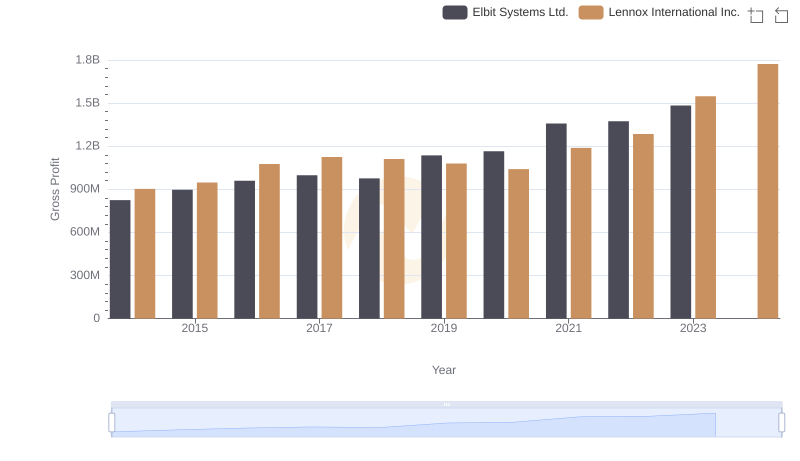
Gross Profit Comparison: Lennox International Inc. and Elbit Systems Ltd. Trends
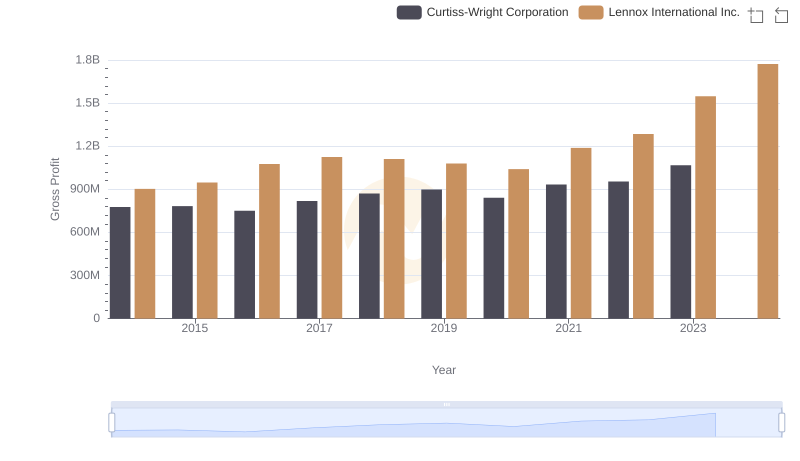
Gross Profit Trends Compared: Lennox International Inc. vs Curtiss-Wright Corporation
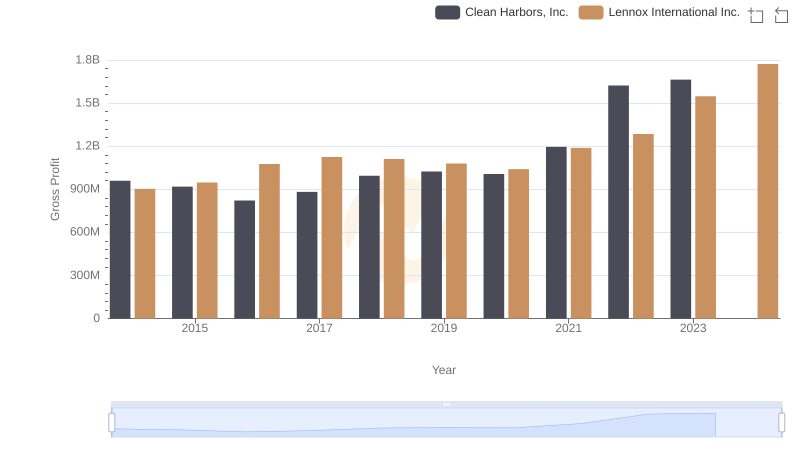
Gross Profit Trends Compared: Lennox International Inc. vs Clean Harbors, Inc.
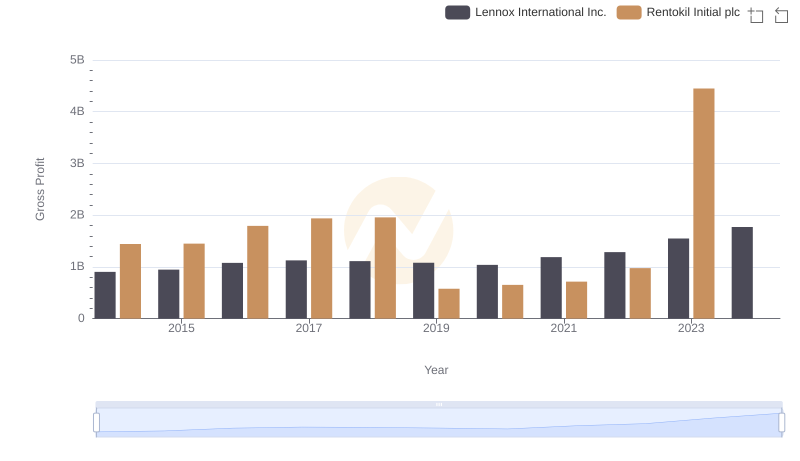
Gross Profit Comparison: Lennox International Inc. and Rentokil Initial plc Trends
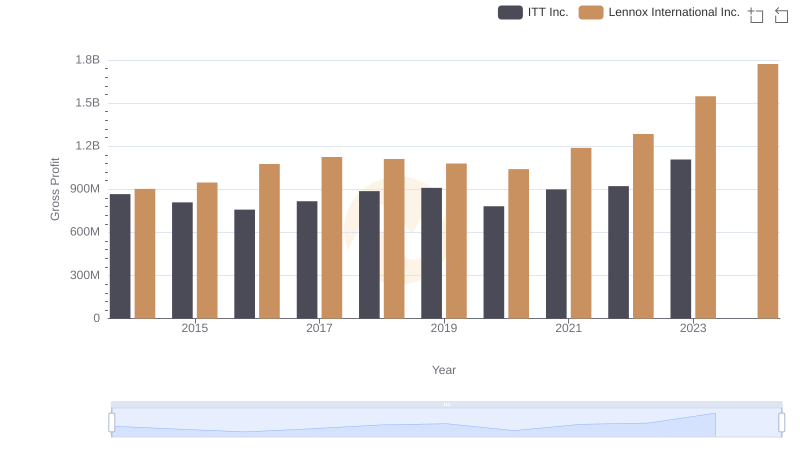
Gross Profit Trends Compared: Lennox International Inc. vs ITT Inc.
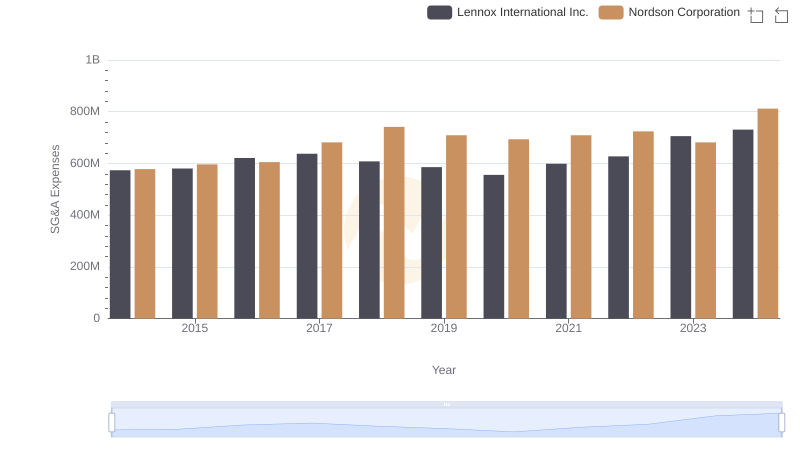
Breaking Down SG&A Expenses: Lennox International Inc. vs Nordson Corporation
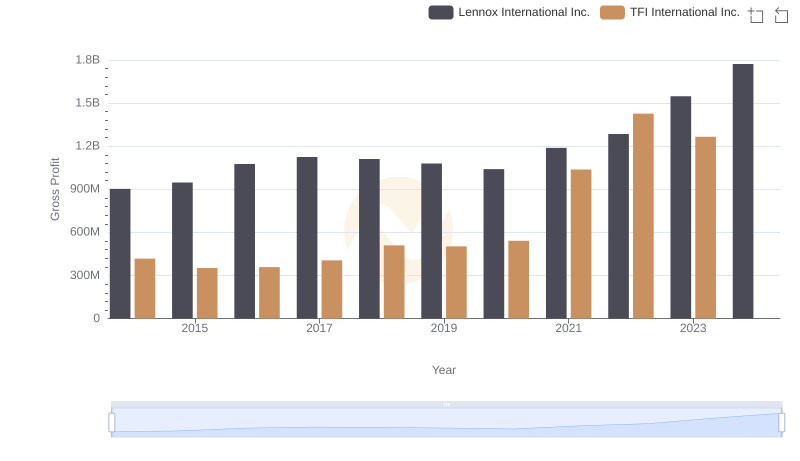
Gross Profit Analysis: Comparing Lennox International Inc. and TFI International Inc.
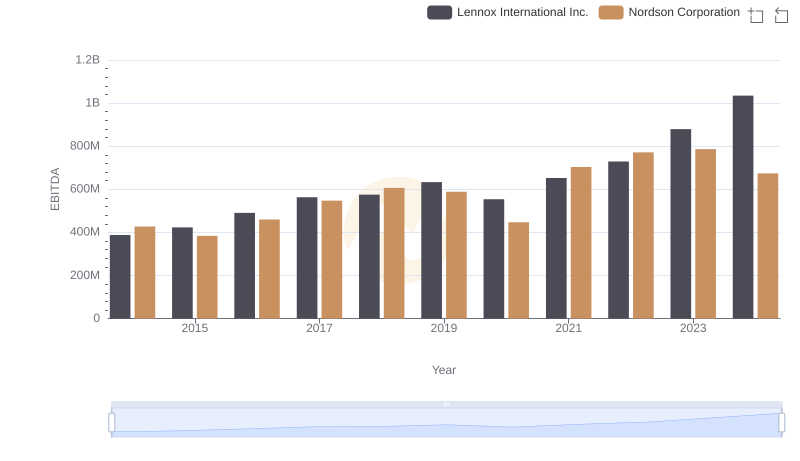
Lennox International Inc. vs Nordson Corporation: In-Depth EBITDA Performance Comparison