| __timestamp | Curtiss-Wright Corporation | Lennox International Inc. |
|---|---|---|
| Wednesday, January 1, 2014 | 67842000 | 60700000 |
| Thursday, January 1, 2015 | 60837000 | 62300000 |
| Friday, January 1, 2016 | 58592000 | 64599999 |
| Sunday, January 1, 2017 | 60308000 | 73600000 |
| Monday, January 1, 2018 | 64525000 | 72200000 |
| Tuesday, January 1, 2019 | 72520000 | 69900000 |
| Wednesday, January 1, 2020 | 74816000 | 66800000 |
| Friday, January 1, 2021 | 88489000 | 76100000 |
| Saturday, January 1, 2022 | 80836000 | 80300000 |
| Sunday, January 1, 2023 | 85764000 | 94000000 |
| Monday, January 1, 2024 | 91647000 | 0 |
Unleashing the power of data
In the competitive landscape of industrial innovation, research and development (R&D) investments are pivotal. Over the past decade, Lennox International Inc. and Curtiss-Wright Corporation have demonstrated their commitment to innovation through substantial R&D spending. From 2014 to 2023, Curtiss-Wright Corporation's R&D expenses grew by approximately 26%, peaking in 2021. Meanwhile, Lennox International Inc. saw a remarkable 55% increase, culminating in 2023. This trend underscores Lennox's aggressive push towards technological advancement.
While Curtiss-Wright maintained a steady investment, Lennox's R&D spending surged, particularly in the last two years, reflecting a strategic pivot towards innovation. The data for 2024 is incomplete, highlighting the dynamic nature of corporate R&D strategies. As these companies continue to innovate, their R&D investments will likely shape the future of their industries.
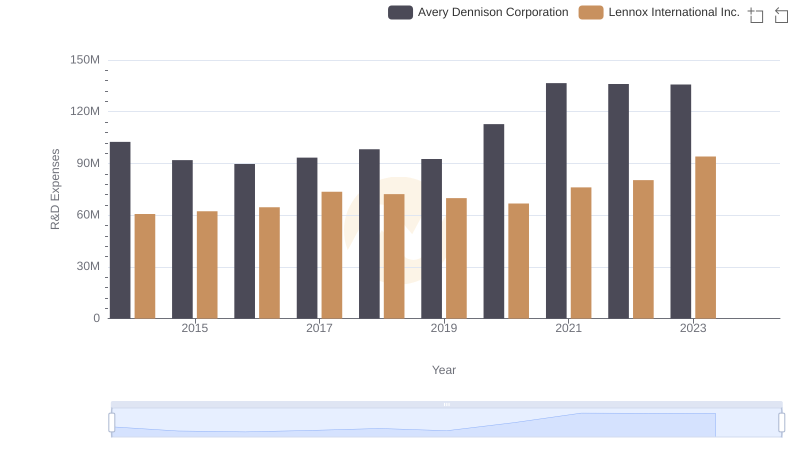
Lennox International Inc. or Avery Dennison Corporation: Who Invests More in Innovation?
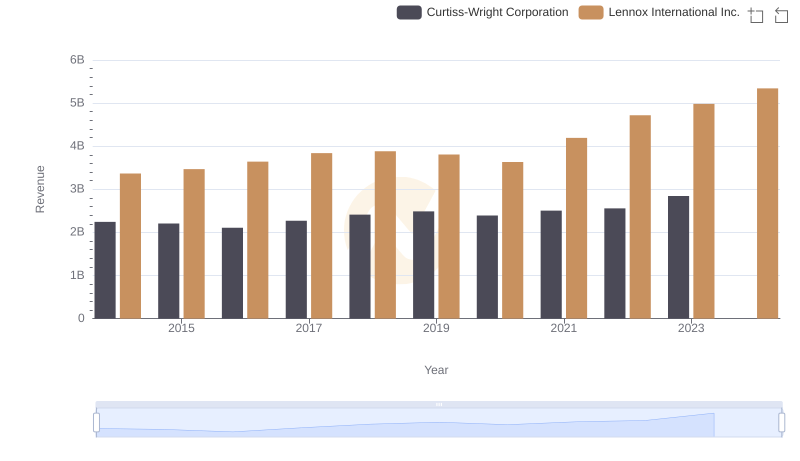
Revenue Showdown: Lennox International Inc. vs Curtiss-Wright Corporation
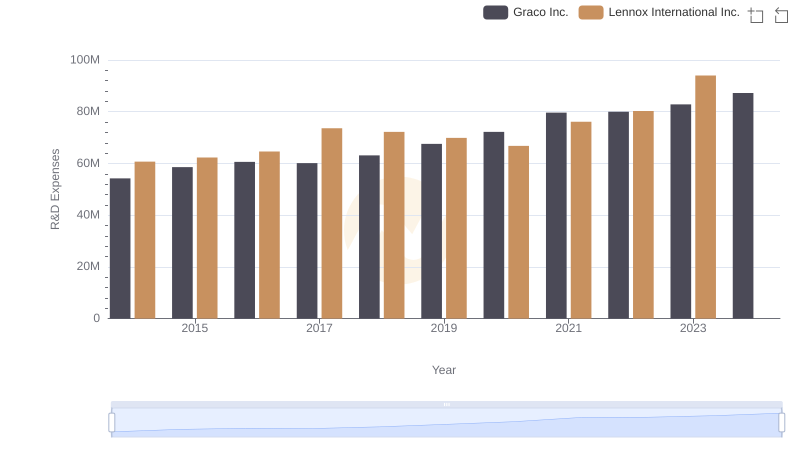
Lennox International Inc. or Graco Inc.: Who Invests More in Innovation?
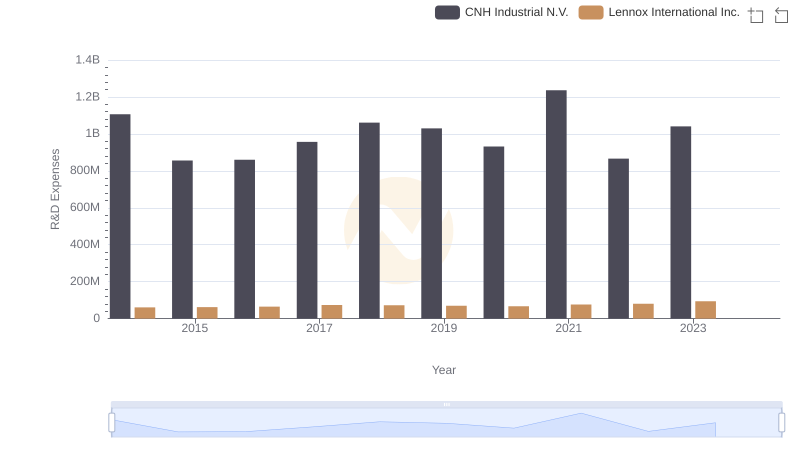
Comparing Innovation Spending: Lennox International Inc. and CNH Industrial N.V.
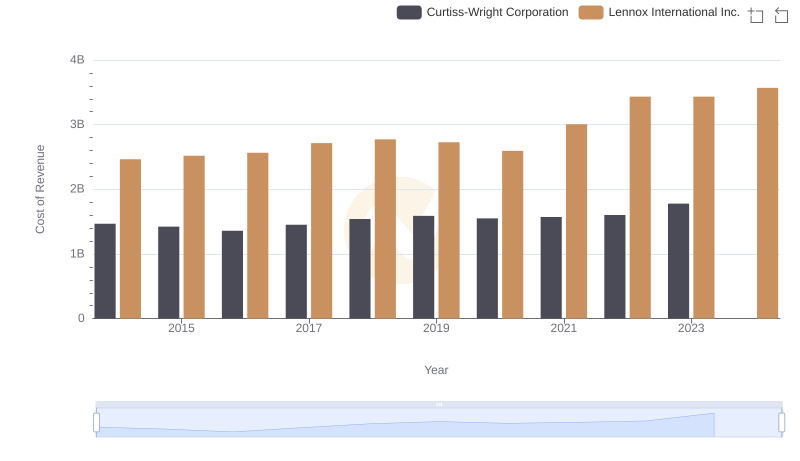
Cost of Revenue Comparison: Lennox International Inc. vs Curtiss-Wright Corporation
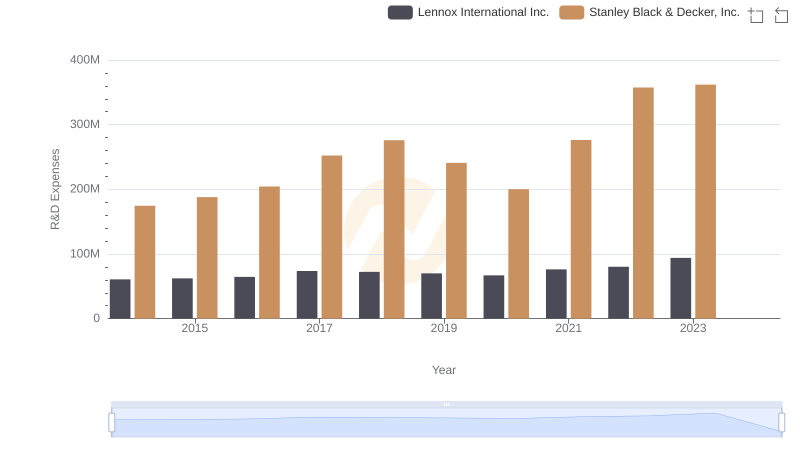
Research and Development: Comparing Key Metrics for Lennox International Inc. and Stanley Black & Decker, Inc.
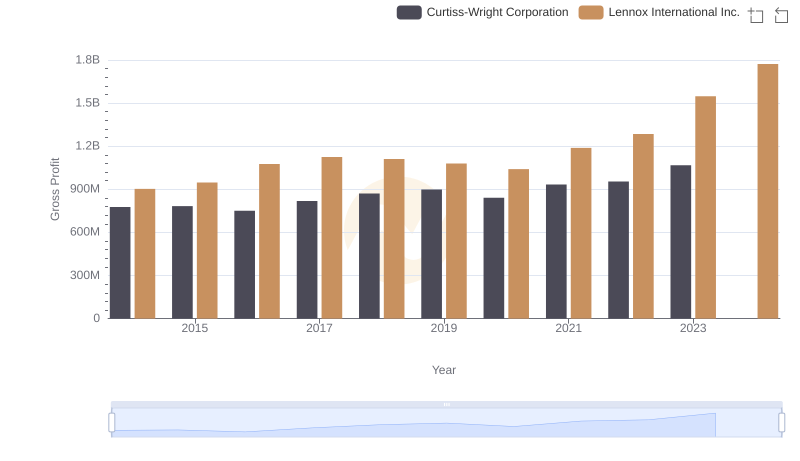
Gross Profit Trends Compared: Lennox International Inc. vs Curtiss-Wright Corporation
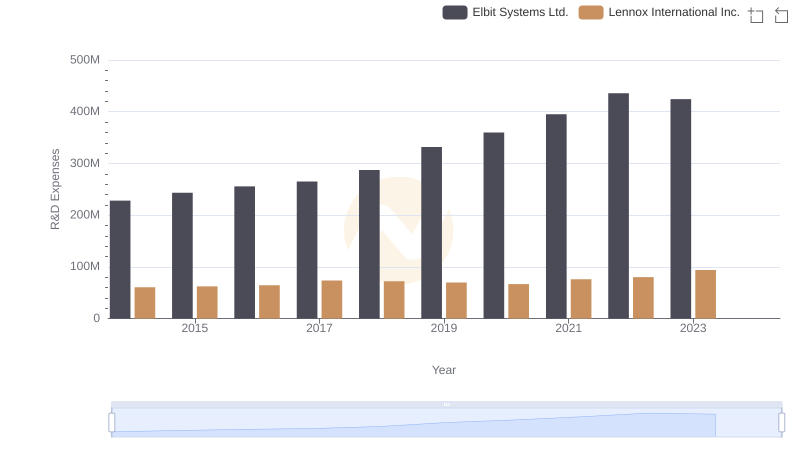
Lennox International Inc. vs Elbit Systems Ltd.: Strategic Focus on R&D Spending
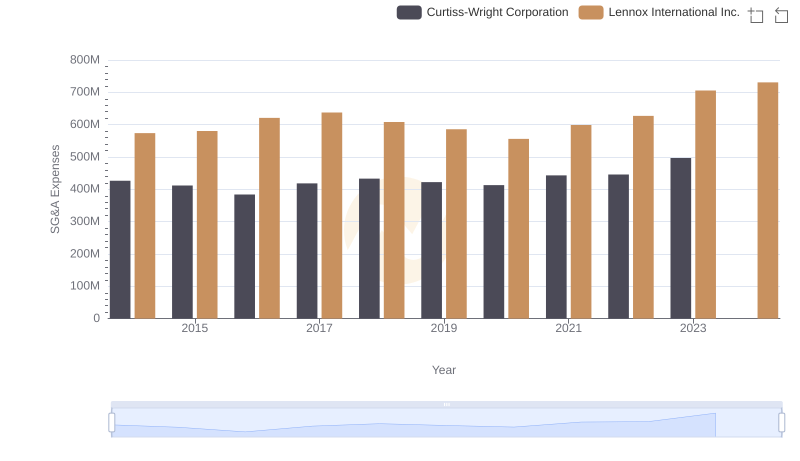
SG&A Efficiency Analysis: Comparing Lennox International Inc. and Curtiss-Wright Corporation
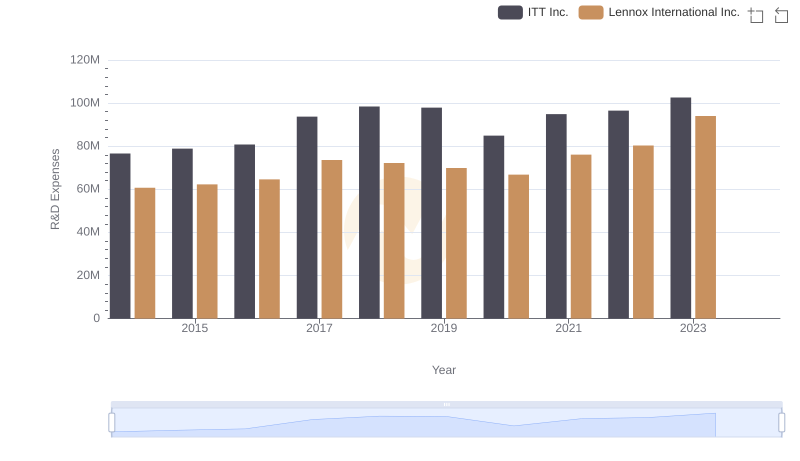
Lennox International Inc. or ITT Inc.: Who Invests More in Innovation?

Professional EBITDA Benchmarking: Lennox International Inc. vs Curtiss-Wright Corporation
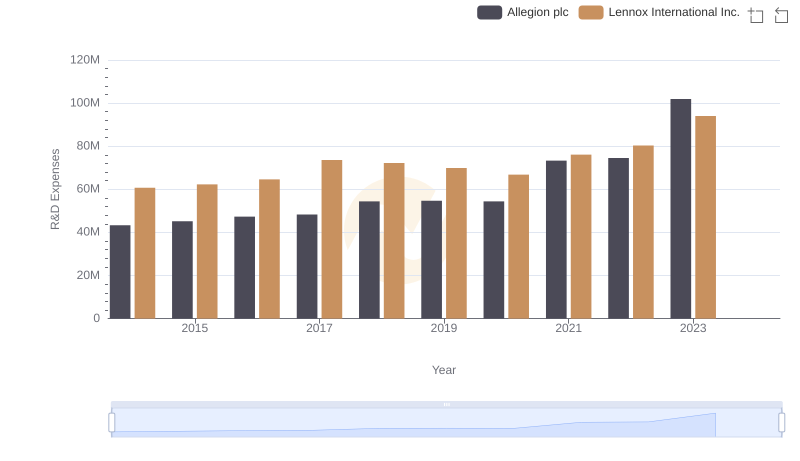
Research and Development: Comparing Key Metrics for Lennox International Inc. and Allegion plc