| __timestamp | FLEETCOR Technologies, Inc. | Intuit Inc. |
|---|---|---|
| Wednesday, January 1, 2014 | 1026053000 | 3838000000 |
| Thursday, January 1, 2015 | 1371792000 | 3467000000 |
| Friday, January 1, 2016 | 1476132000 | 3942000000 |
| Sunday, January 1, 2017 | 1819925000 | 4368000000 |
| Monday, January 1, 2018 | 1945797000 | 4987000000 |
| Tuesday, January 1, 2019 | 2118179000 | 5617000000 |
| Wednesday, January 1, 2020 | 1792492000 | 6301000000 |
| Friday, January 1, 2021 | 2273917000 | 7950000000 |
| Saturday, January 1, 2022 | 2662422000 | 10320000000 |
| Sunday, January 1, 2023 | 2727580001 | 11225000000 |
| Monday, January 1, 2024 | 3974589000 | 12820000000 |
Unleashing insights
In the ever-evolving landscape of financial technology, understanding the gross profit trends of industry leaders is crucial. Over the past decade, Intuit Inc. and FLEETCOR Technologies, Inc. have showcased distinct trajectories in their financial performance. From 2014 to 2023, Intuit Inc. has seen a remarkable growth in gross profit, surging by approximately 193%, from $3.8 billion to $11.2 billion. This growth underscores Intuit's robust market strategies and its ability to adapt to changing consumer needs.
Conversely, FLEETCOR Technologies, Inc. has experienced a steady, albeit slower, increase in gross profit, growing by about 166% from $1 billion in 2014 to $2.7 billion in 2023. This data highlights FLEETCOR's consistent performance in a competitive market. Notably, the data for 2024 is incomplete, leaving room for speculation on future trends. As these companies continue to innovate, their financial trajectories will be pivotal in shaping the fintech landscape.
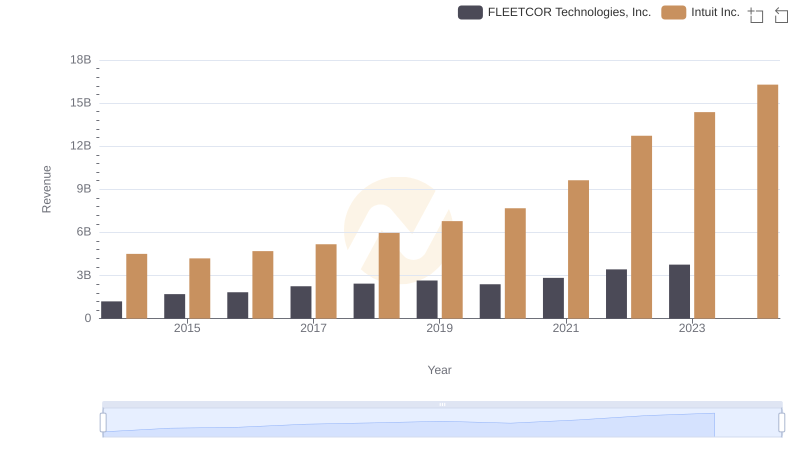
Revenue Showdown: Intuit Inc. vs FLEETCOR Technologies, Inc.
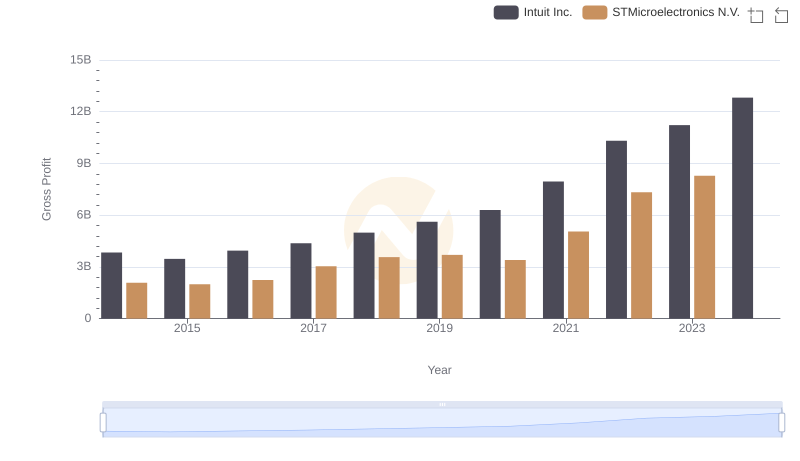
Gross Profit Analysis: Comparing Intuit Inc. and STMicroelectronics N.V.
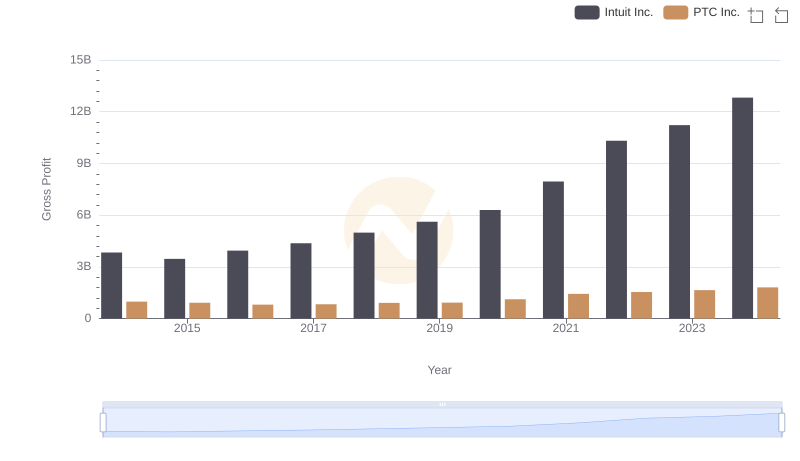
Gross Profit Analysis: Comparing Intuit Inc. and PTC Inc.
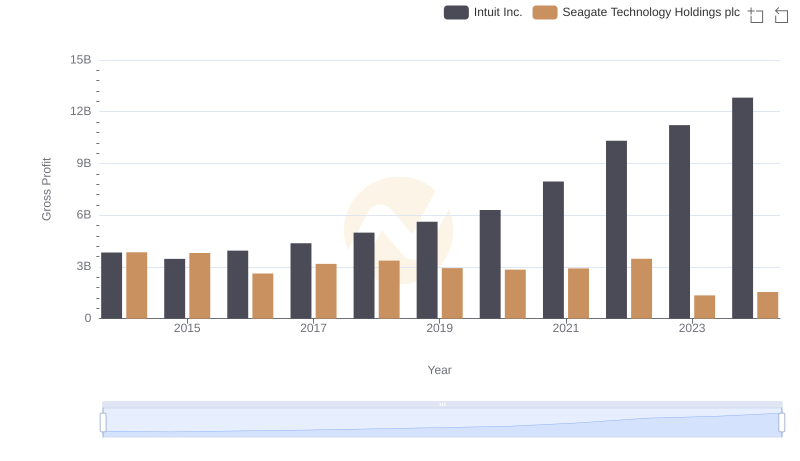
Gross Profit Analysis: Comparing Intuit Inc. and Seagate Technology Holdings plc
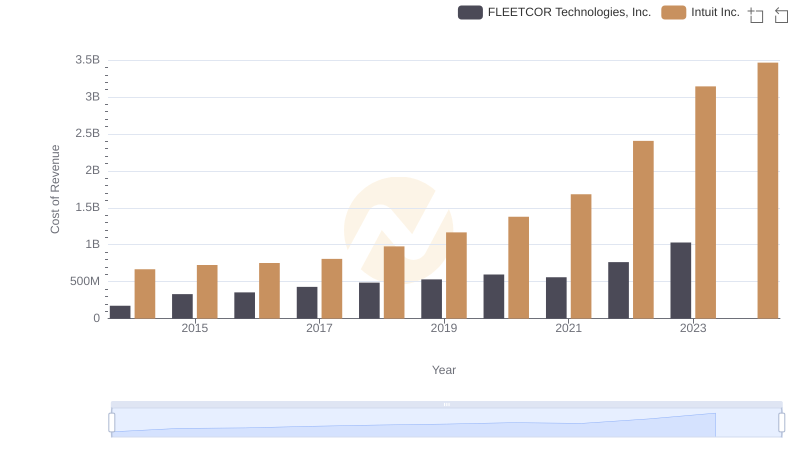
Comparing Cost of Revenue Efficiency: Intuit Inc. vs FLEETCOR Technologies, Inc.
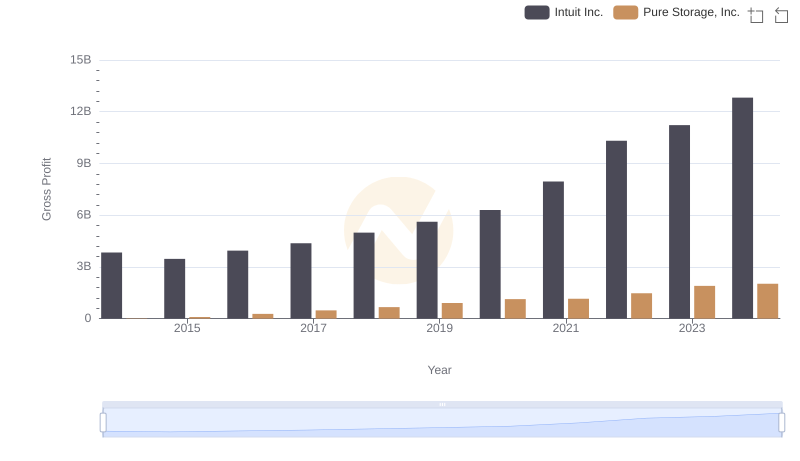
Intuit Inc. vs Pure Storage, Inc.: A Gross Profit Performance Breakdown
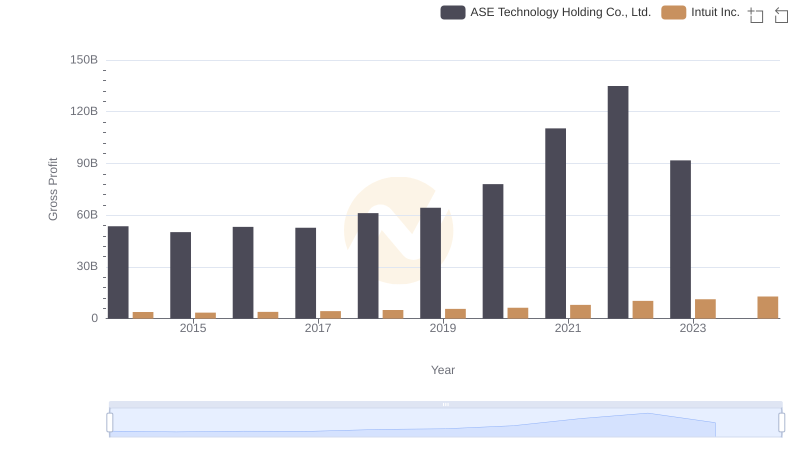
Intuit Inc. vs ASE Technology Holding Co., Ltd.: A Gross Profit Performance Breakdown
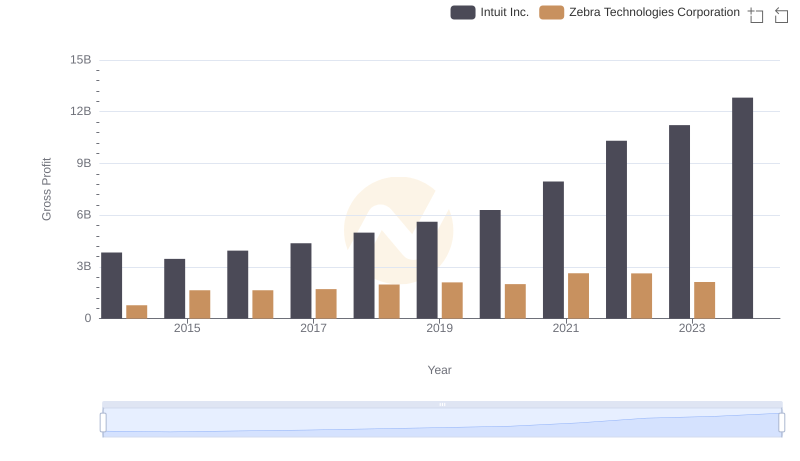
Who Generates Higher Gross Profit? Intuit Inc. or Zebra Technologies Corporation
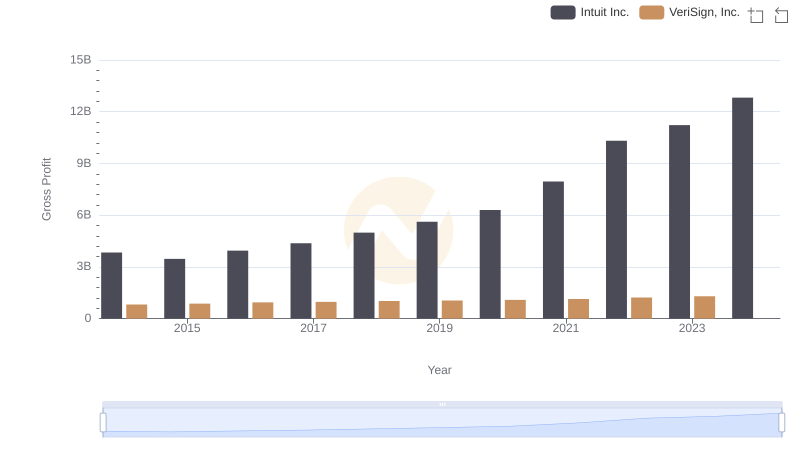
Gross Profit Comparison: Intuit Inc. and VeriSign, Inc. Trends
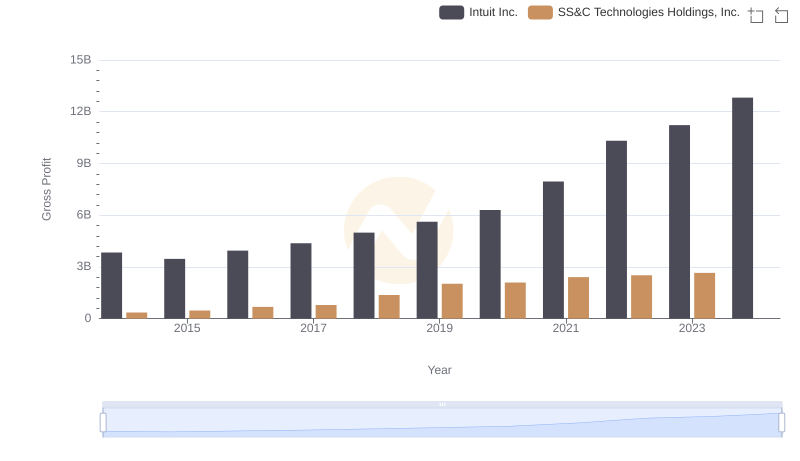
Gross Profit Comparison: Intuit Inc. and SS&C Technologies Holdings, Inc. Trends
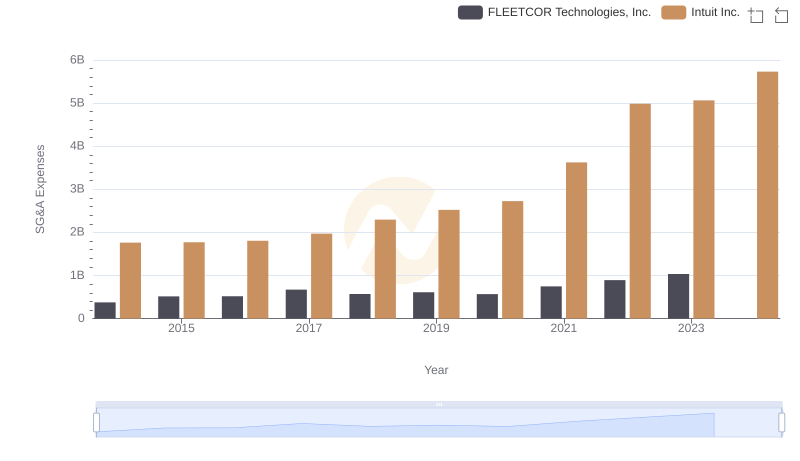
Comparing SG&A Expenses: Intuit Inc. vs FLEETCOR Technologies, Inc. Trends and Insights
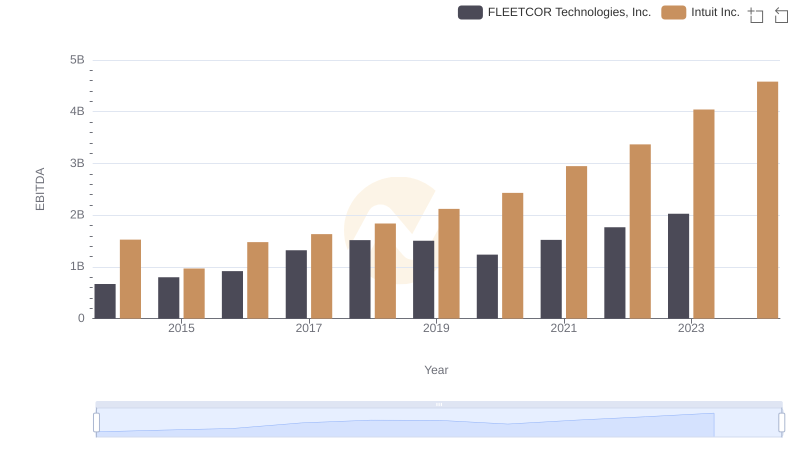
Professional EBITDA Benchmarking: Intuit Inc. vs FLEETCOR Technologies, Inc.