| __timestamp | Intuit Inc. | PTC Inc. |
|---|---|---|
| Wednesday, January 1, 2014 | 3838000000 | 983284000 |
| Thursday, January 1, 2015 | 3467000000 | 920508000 |
| Friday, January 1, 2016 | 3942000000 | 814868000 |
| Sunday, January 1, 2017 | 4368000000 | 835020000 |
| Monday, January 1, 2018 | 4987000000 | 915630000 |
| Tuesday, January 1, 2019 | 5617000000 | 930253000 |
| Wednesday, January 1, 2020 | 6301000000 | 1124144000 |
| Friday, January 1, 2021 | 7950000000 | 1436057000 |
| Saturday, January 1, 2022 | 10320000000 | 1547367000 |
| Sunday, January 1, 2023 | 11225000000 | 1656047000 |
| Monday, January 1, 2024 | 12820000000 | 1811638000 |
Igniting the spark of knowledge
In the ever-evolving landscape of financial technology, Intuit Inc. and PTC Inc. have emerged as key players. Over the past decade, Intuit has demonstrated a remarkable growth trajectory, with its gross profit surging by approximately 233% from 2014 to 2024. This growth reflects Intuit's strategic innovations and market adaptability. In contrast, PTC Inc. has also shown a steady increase, with its gross profit rising by about 84% over the same period. This growth underscores PTC's resilience and commitment to expanding its market share.
This analysis provides a snapshot of the competitive dynamics between these two industry leaders.
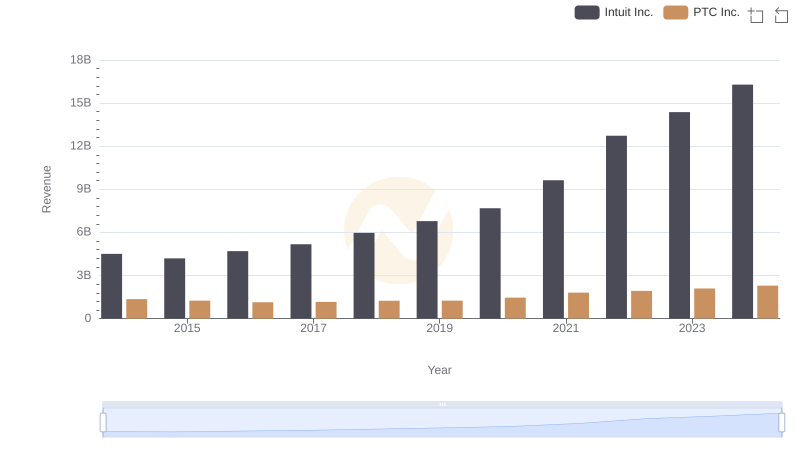
Annual Revenue Comparison: Intuit Inc. vs PTC Inc.
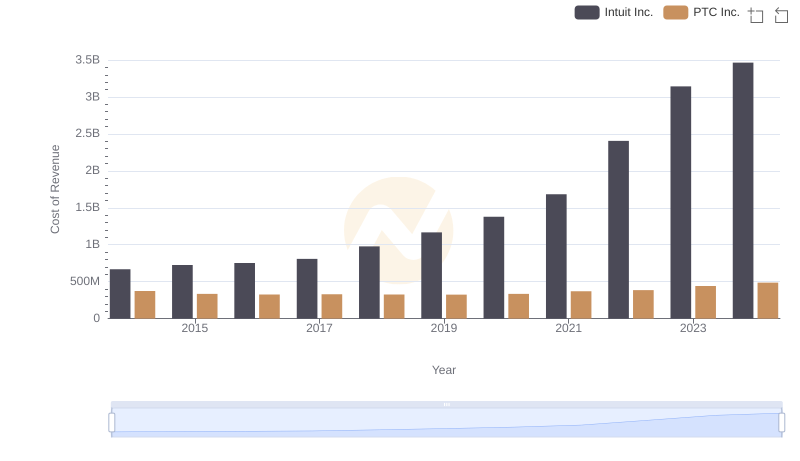
Cost of Revenue: Key Insights for Intuit Inc. and PTC Inc.
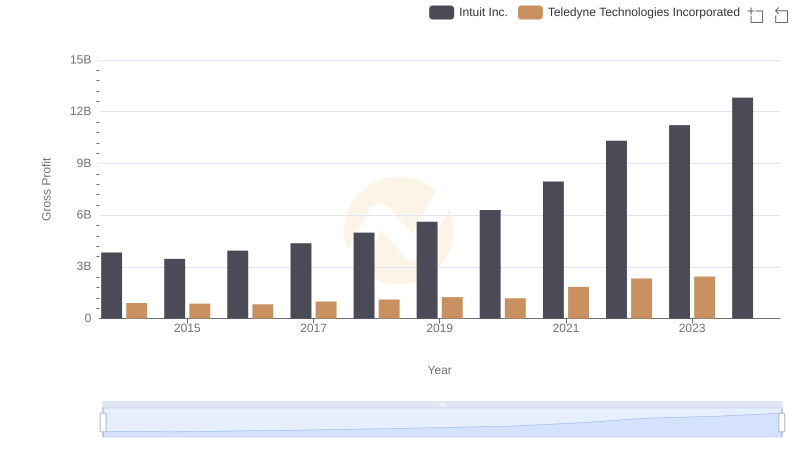
Intuit Inc. vs Teledyne Technologies Incorporated: A Gross Profit Performance Breakdown
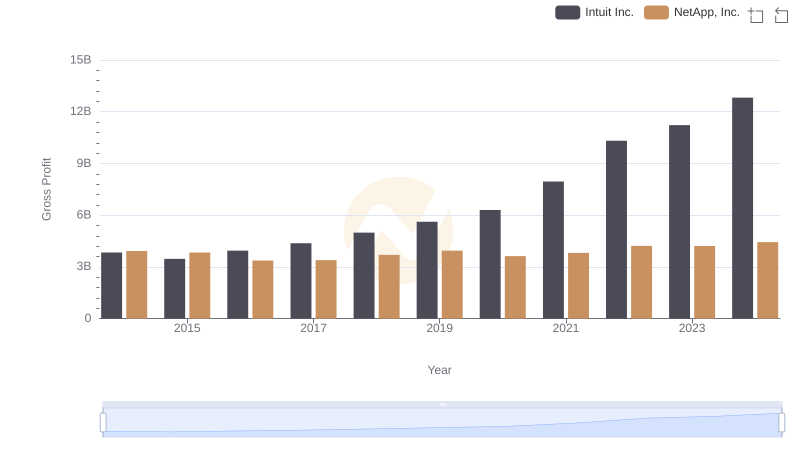
Gross Profit Trends Compared: Intuit Inc. vs NetApp, Inc.

Intuit Inc. vs ON Semiconductor Corporation: A Gross Profit Performance Breakdown
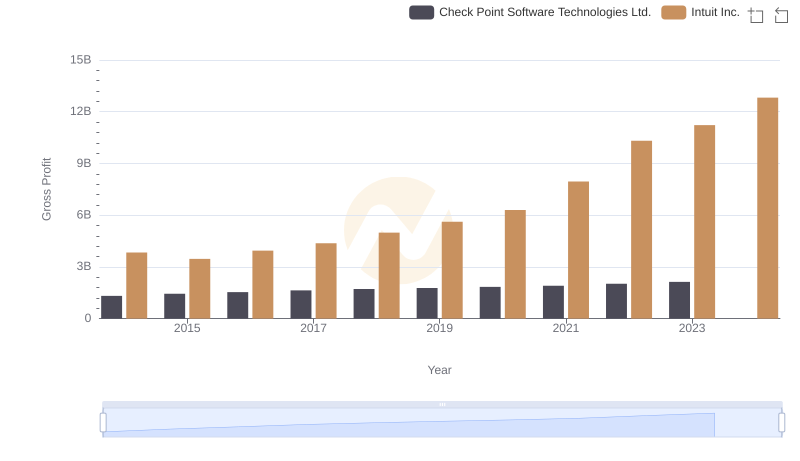
Who Generates Higher Gross Profit? Intuit Inc. or Check Point Software Technologies Ltd.
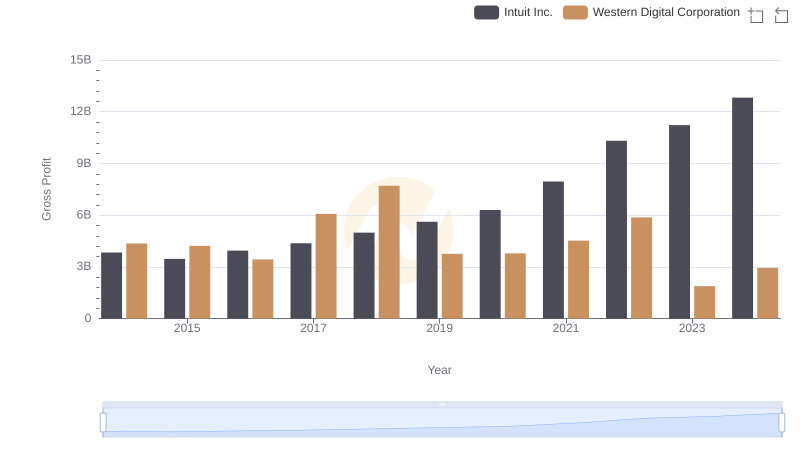
Intuit Inc. and Western Digital Corporation: A Detailed Gross Profit Analysis
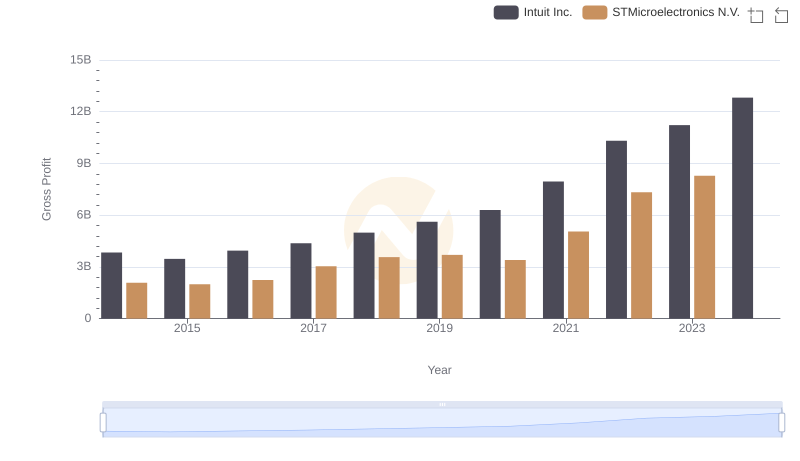
Gross Profit Analysis: Comparing Intuit Inc. and STMicroelectronics N.V.
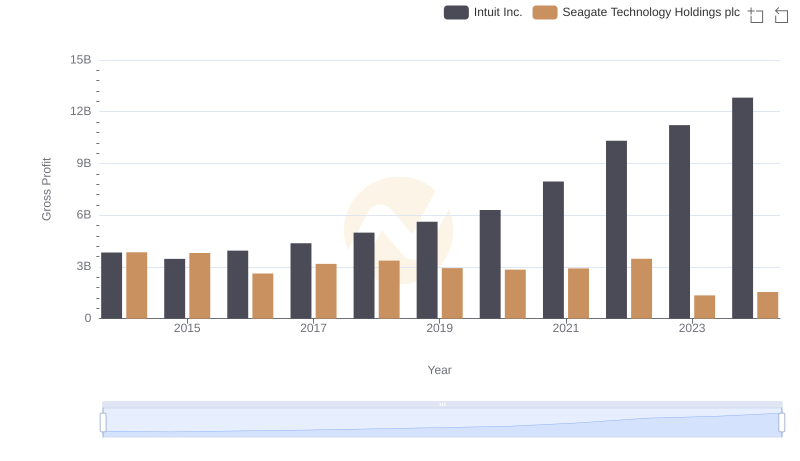
Gross Profit Analysis: Comparing Intuit Inc. and Seagate Technology Holdings plc
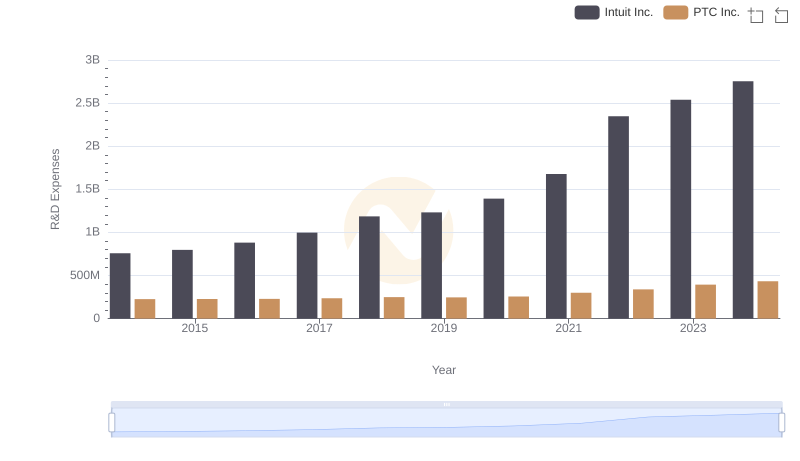
Who Prioritizes Innovation? R&D Spending Compared for Intuit Inc. and PTC Inc.
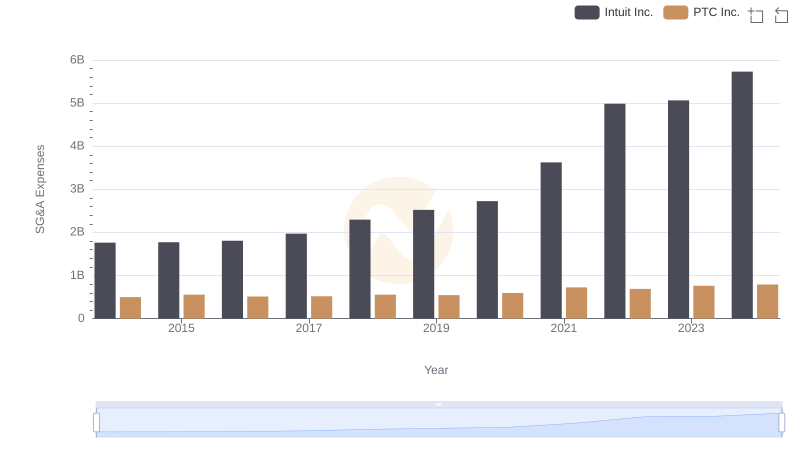
Selling, General, and Administrative Costs: Intuit Inc. vs PTC Inc.
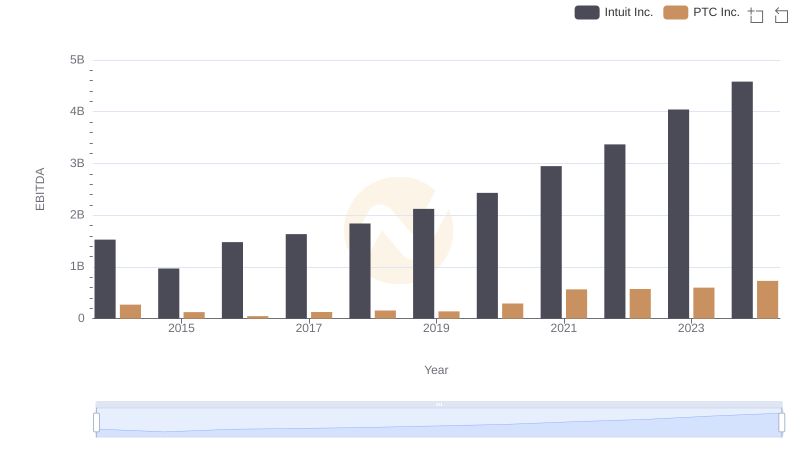
Intuit Inc. vs PTC Inc.: In-Depth EBITDA Performance Comparison