| __timestamp | International Business Machines Corporation | Tyler Technologies, Inc. |
|---|---|---|
| Wednesday, January 1, 2014 | 46407000000 | 233371000 |
| Thursday, January 1, 2015 | 40684000000 | 277187000 |
| Friday, January 1, 2016 | 38516000000 | 355351000 |
| Sunday, January 1, 2017 | 36943000000 | 399140000 |
| Monday, January 1, 2018 | 36936000000 | 439578000 |
| Tuesday, January 1, 2019 | 31533000000 | 516900000 |
| Wednesday, January 1, 2020 | 30865000000 | 542512000 |
| Friday, January 1, 2021 | 31486000000 | 709644000 |
| Saturday, January 1, 2022 | 32687000000 | 783863000 |
| Sunday, January 1, 2023 | 34300000000 | 861099000 |
| Monday, January 1, 2024 | 35551000000 | 935761000 |
Unveiling the hidden dimensions of data
In the ever-evolving landscape of technology, the financial performance of industry giants like International Business Machines Corporation (IBM) and emerging players such as Tyler Technologies, Inc. offers intriguing insights. Over the past decade, IBM's gross profit has seen a decline of approximately 26%, from a peak in 2014 to a low in 2021. This trend reflects the challenges faced by traditional tech behemoths in adapting to new market dynamics.
Conversely, Tyler Technologies has demonstrated robust growth, with its gross profit surging by nearly 270% from 2014 to 2023. This impressive trajectory underscores the increasing demand for specialized software solutions in public sector markets. While IBM's gross profit rebounded slightly in 2023, Tyler Technologies continues to close the gap, highlighting the shifting tides in the tech industry. Missing data for 2024 suggests ongoing volatility, making future trends worth watching.
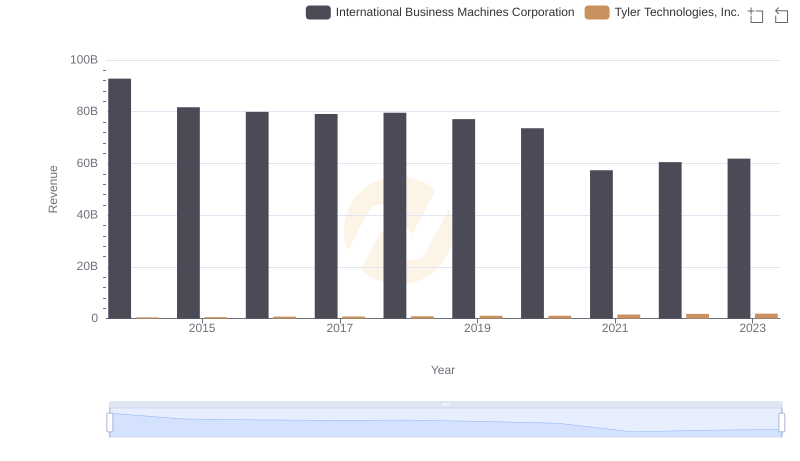
International Business Machines Corporation vs Tyler Technologies, Inc.: Examining Key Revenue Metrics
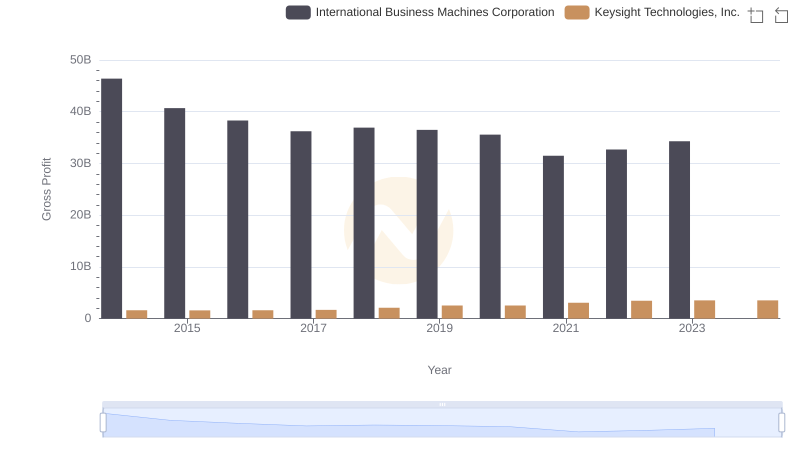
International Business Machines Corporation and Keysight Technologies, Inc.: A Detailed Gross Profit Analysis
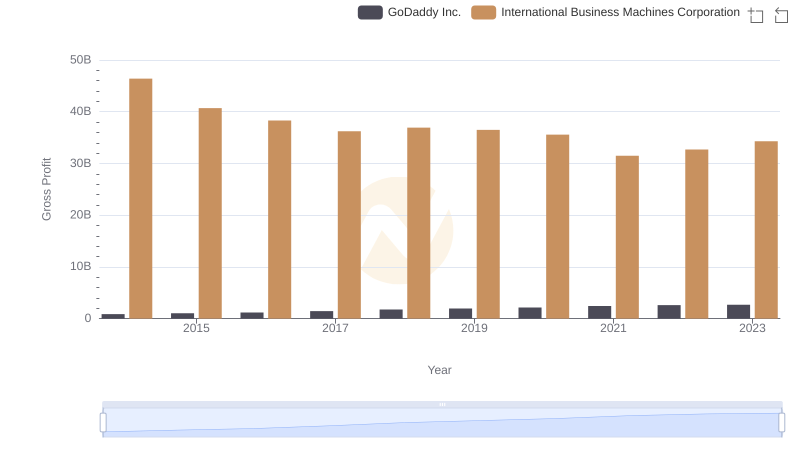
Gross Profit Comparison: International Business Machines Corporation and GoDaddy Inc. Trends
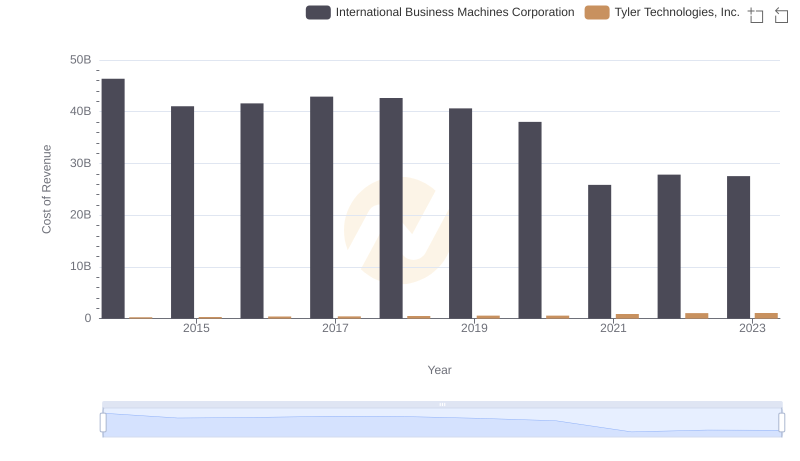
Cost of Revenue: Key Insights for International Business Machines Corporation and Tyler Technologies, Inc.
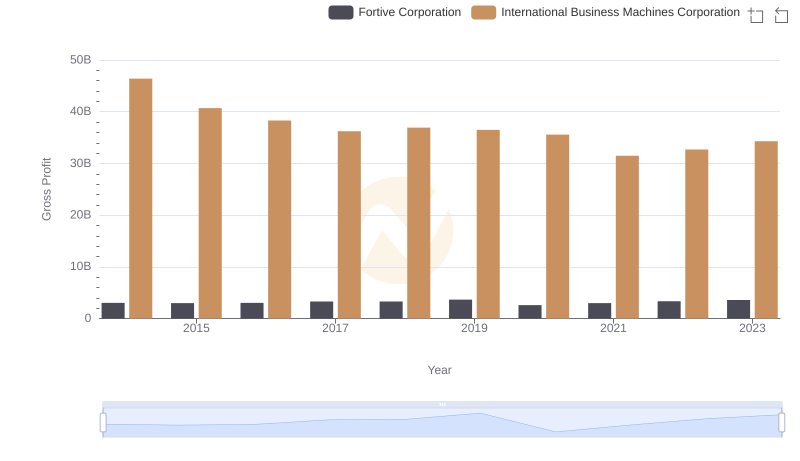
International Business Machines Corporation and Fortive Corporation: A Detailed Gross Profit Analysis
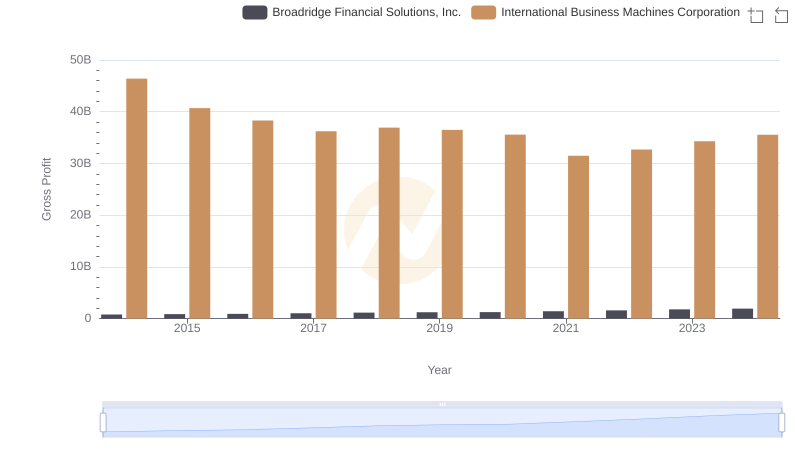
Gross Profit Trends Compared: International Business Machines Corporation vs Broadridge Financial Solutions, Inc.
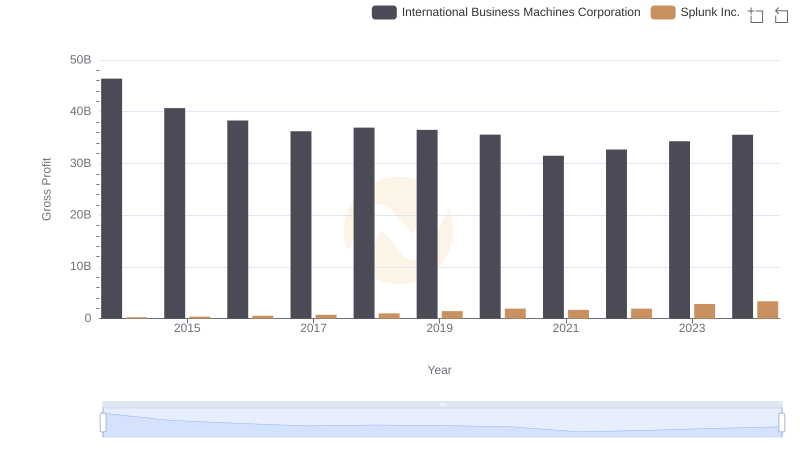
Gross Profit Trends Compared: International Business Machines Corporation vs Splunk Inc.
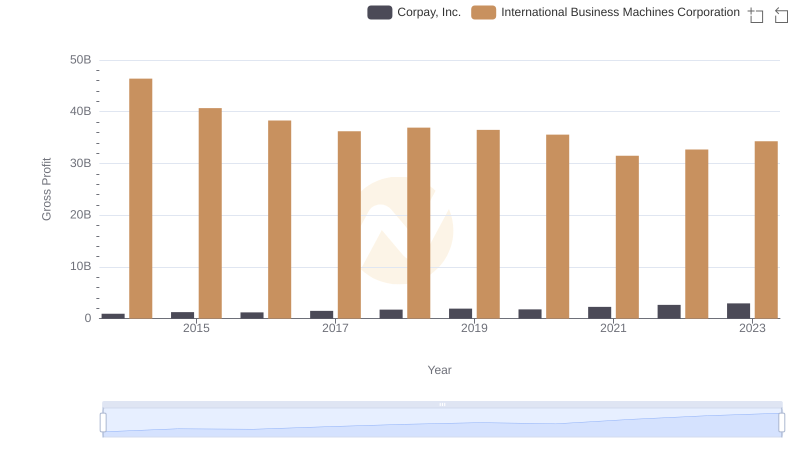
Who Generates Higher Gross Profit? International Business Machines Corporation or Corpay, Inc.
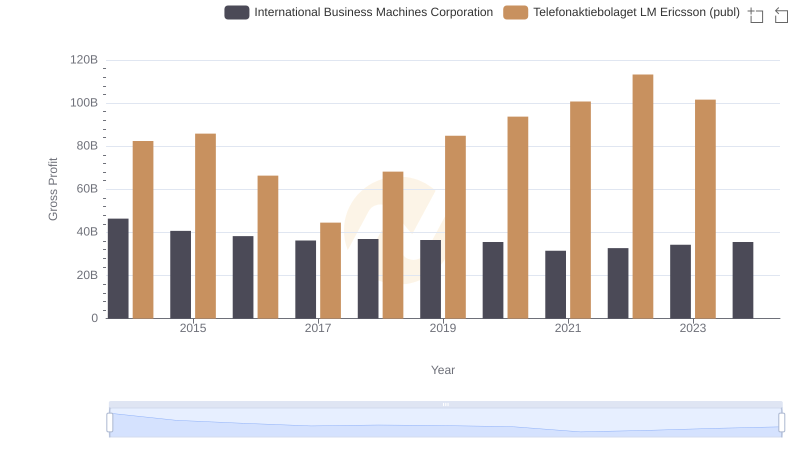
Key Insights on Gross Profit: International Business Machines Corporation vs Telefonaktiebolaget LM Ericsson (publ)
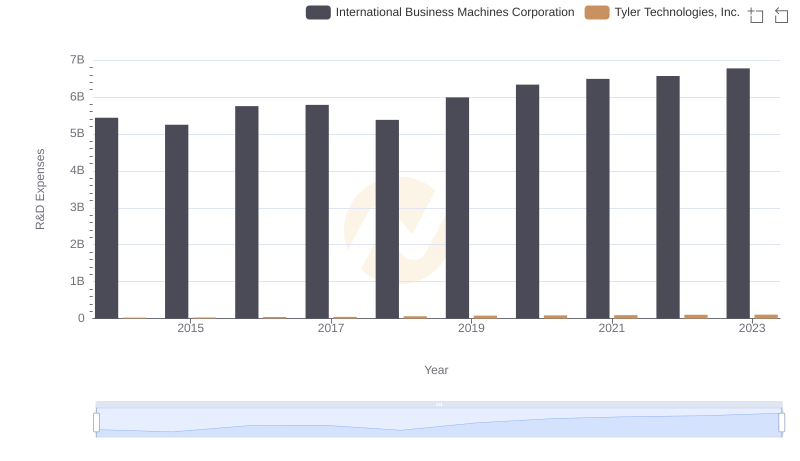
Research and Development Investment: International Business Machines Corporation vs Tyler Technologies, Inc.
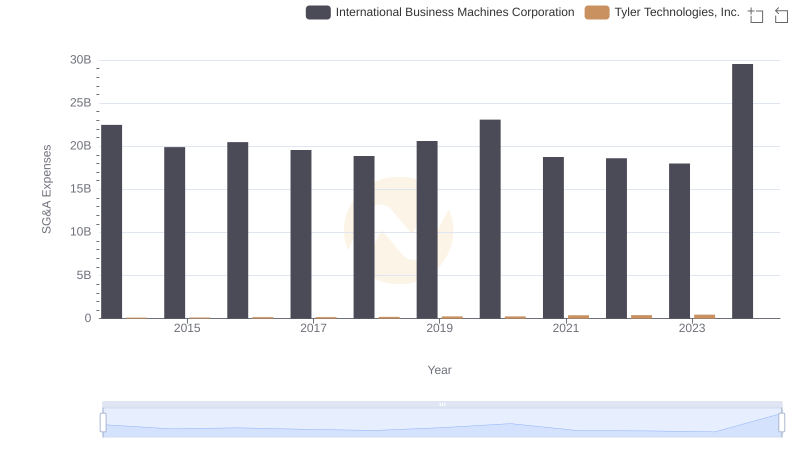
Comparing SG&A Expenses: International Business Machines Corporation vs Tyler Technologies, Inc. Trends and Insights
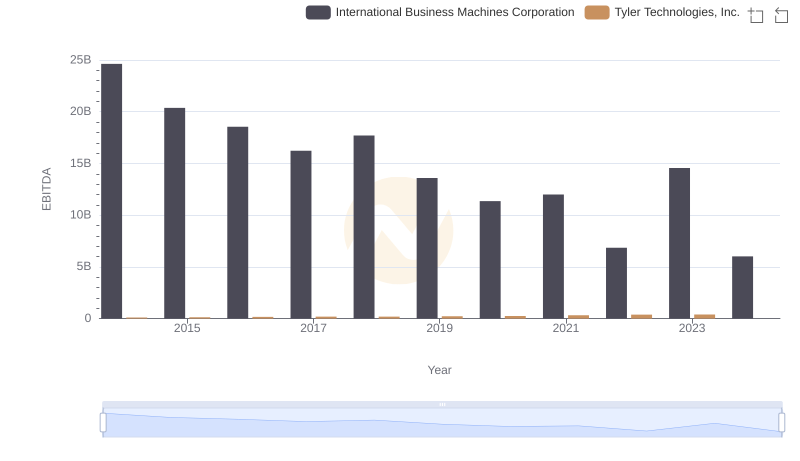
EBITDA Metrics Evaluated: International Business Machines Corporation vs Tyler Technologies, Inc.