| __timestamp | International Business Machines Corporation | Keysight Technologies, Inc. |
|---|---|---|
| Wednesday, January 1, 2014 | 46407000000 | 1620000000 |
| Thursday, January 1, 2015 | 40684000000 | 1592000000 |
| Friday, January 1, 2016 | 38516000000 | 1624000000 |
| Sunday, January 1, 2017 | 36943000000 | 1702000000 |
| Monday, January 1, 2018 | 36936000000 | 2111000000 |
| Tuesday, January 1, 2019 | 31533000000 | 2534000000 |
| Wednesday, January 1, 2020 | 30865000000 | 2533000000 |
| Friday, January 1, 2021 | 31486000000 | 3069000000 |
| Saturday, January 1, 2022 | 32687000000 | 3450000000 |
| Sunday, January 1, 2023 | 34300000000 | 3532000000 |
| Monday, January 1, 2024 | 35551000000 | 3527000000 |
Data in motion
In the ever-evolving landscape of technology, the financial performance of industry leaders like International Business Machines Corporation (IBM) and Keysight Technologies, Inc. offers a fascinating glimpse into their strategic maneuvers. Over the past decade, IBM's gross profit has seen a decline of approximately 24%, from a peak in 2014 to a more modest figure in 2024. This trend reflects IBM's ongoing transformation and adaptation to new market demands.
Conversely, Keysight Technologies has demonstrated a robust growth trajectory, with its gross profit more than doubling since 2014. This impressive 118% increase underscores Keysight's successful expansion and innovation in the electronic measurement industry.
As we look to the future, these trends highlight the dynamic nature of the tech industry, where adaptability and innovation are key to sustaining growth and profitability.
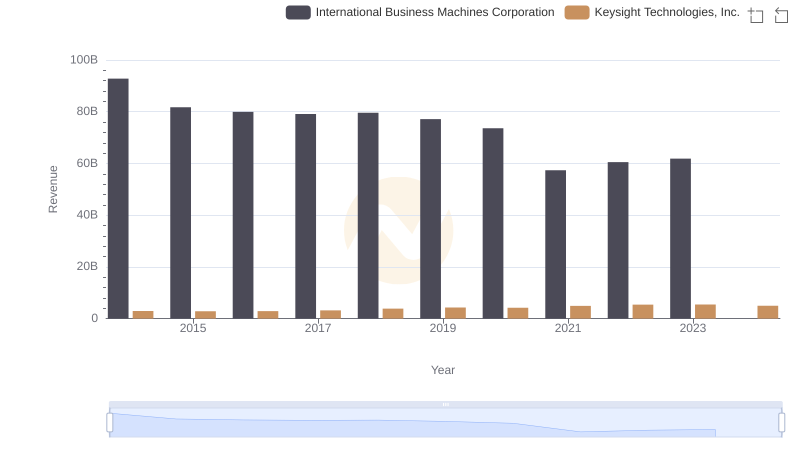
International Business Machines Corporation or Keysight Technologies, Inc.: Who Leads in Yearly Revenue?
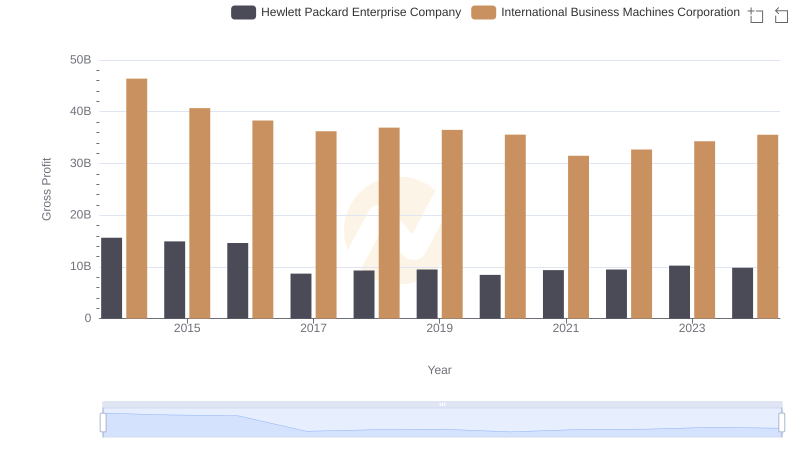
Gross Profit Analysis: Comparing International Business Machines Corporation and Hewlett Packard Enterprise Company
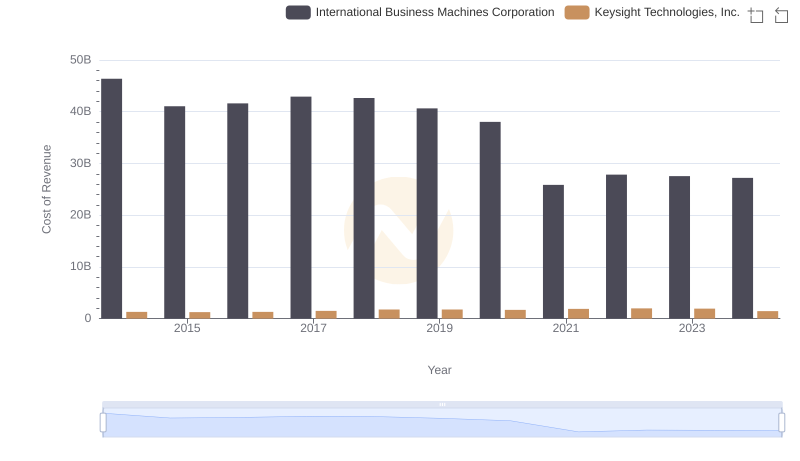
Cost of Revenue Trends: International Business Machines Corporation vs Keysight Technologies, Inc.
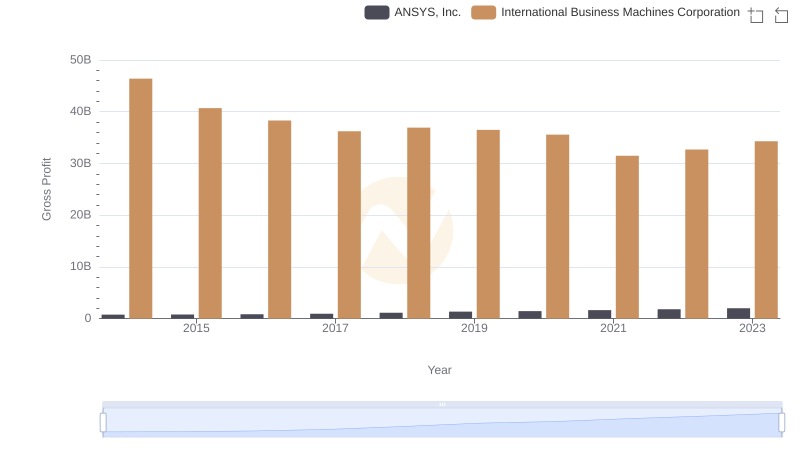
Gross Profit Comparison: International Business Machines Corporation and ANSYS, Inc. Trends
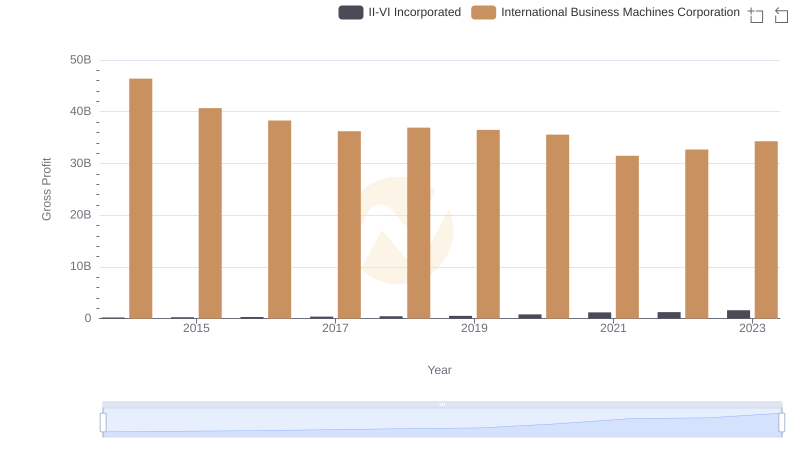
Gross Profit Trends Compared: International Business Machines Corporation vs II-VI Incorporated
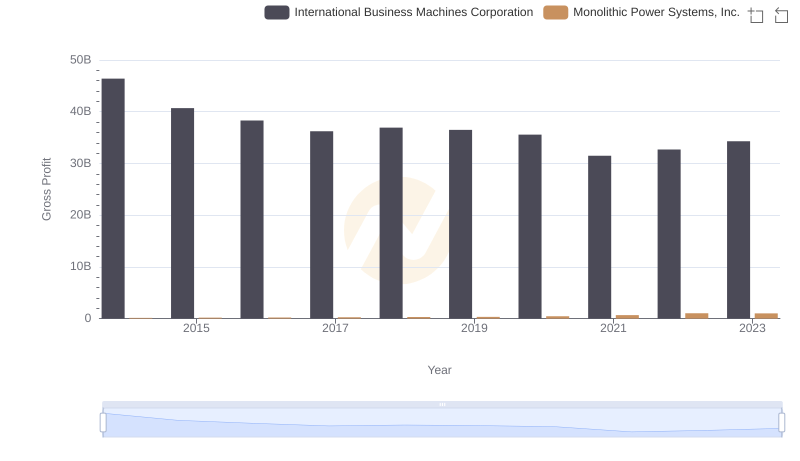
Key Insights on Gross Profit: International Business Machines Corporation vs Monolithic Power Systems, Inc.
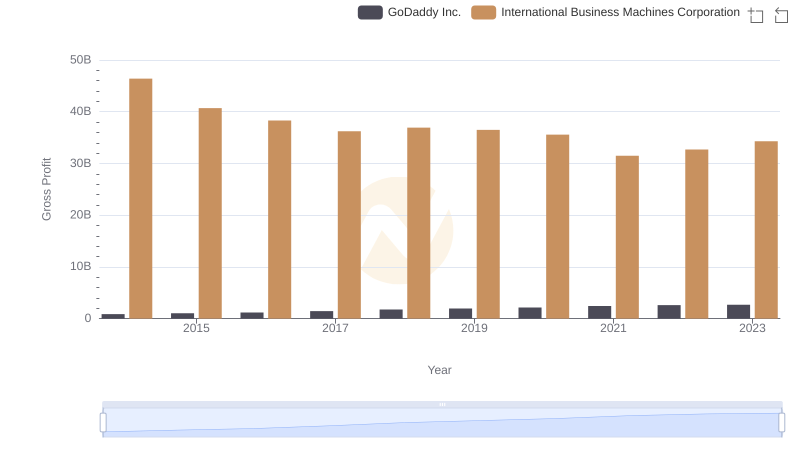
Gross Profit Comparison: International Business Machines Corporation and GoDaddy Inc. Trends
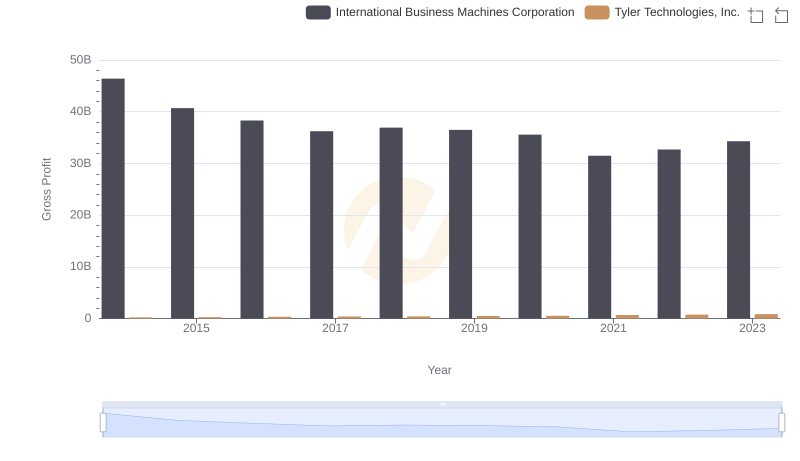
Gross Profit Analysis: Comparing International Business Machines Corporation and Tyler Technologies, Inc.
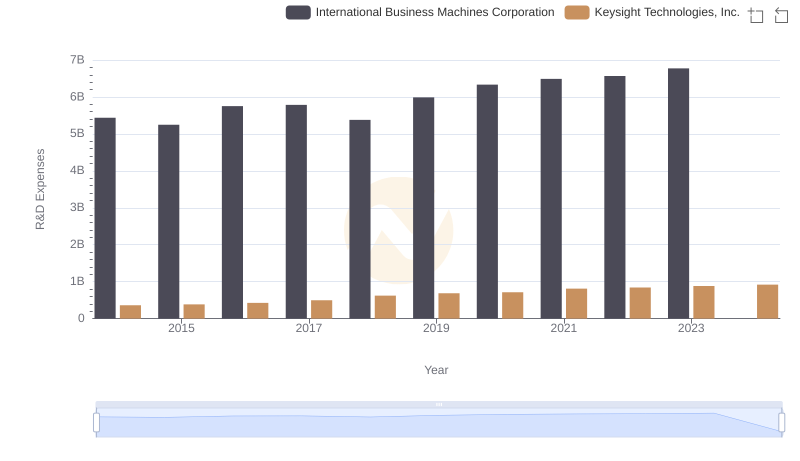
Research and Development Expenses Breakdown: International Business Machines Corporation vs Keysight Technologies, Inc.
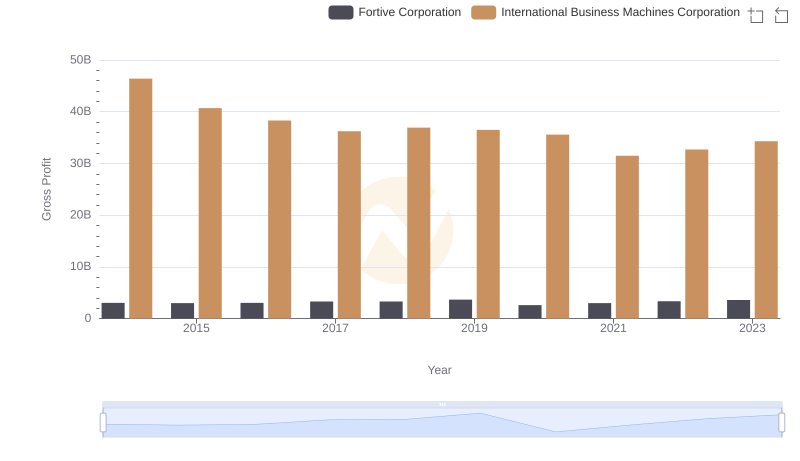
International Business Machines Corporation and Fortive Corporation: A Detailed Gross Profit Analysis
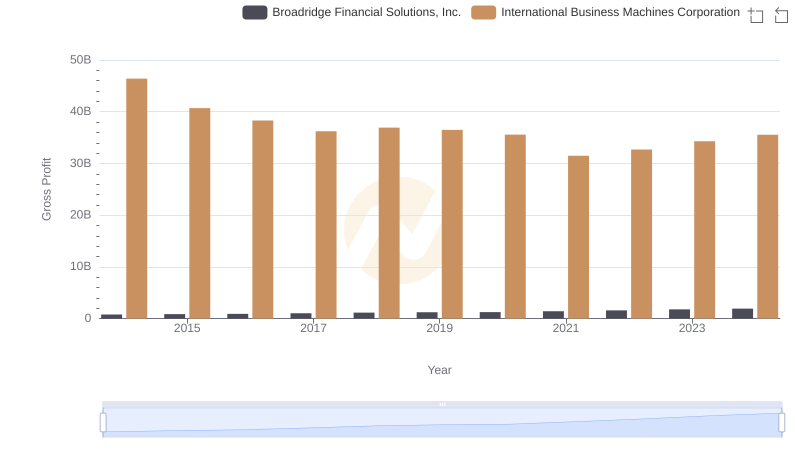
Gross Profit Trends Compared: International Business Machines Corporation vs Broadridge Financial Solutions, Inc.
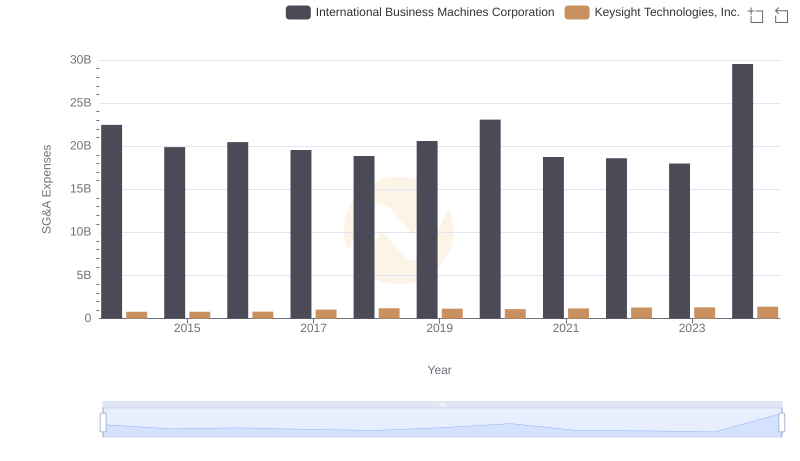
Cost Management Insights: SG&A Expenses for International Business Machines Corporation and Keysight Technologies, Inc.