| __timestamp | International Business Machines Corporation | Telefonaktiebolaget LM Ericsson (publ) |
|---|---|---|
| Wednesday, January 1, 2014 | 46407000000 | 82427000000 |
| Thursday, January 1, 2015 | 40684000000 | 85819000000 |
| Friday, January 1, 2016 | 38516000000 | 66365000000 |
| Sunday, January 1, 2017 | 36943000000 | 44545000000 |
| Monday, January 1, 2018 | 36936000000 | 68200000000 |
| Tuesday, January 1, 2019 | 31533000000 | 84824000000 |
| Wednesday, January 1, 2020 | 30865000000 | 93724000000 |
| Friday, January 1, 2021 | 31486000000 | 100749000000 |
| Saturday, January 1, 2022 | 32687000000 | 113295000000 |
| Sunday, January 1, 2023 | 34300000000 | 101602000000 |
| Monday, January 1, 2024 | 35551000000 |
Cracking the code
In the ever-evolving landscape of global technology giants, International Business Machines Corporation (IBM) and Telefonaktiebolaget LM Ericsson (publ) have been pivotal players. Over the past decade, from 2014 to 2023, these companies have showcased contrasting trajectories in their gross profit margins.
IBM's gross profit has seen a gradual decline, starting at a peak in 2014 and dropping by approximately 26% by 2023. This trend reflects the challenges IBM has faced in adapting to the rapidly changing tech environment.
Conversely, Ericsson has demonstrated resilience, with its gross profit increasing by about 23% from 2014 to 2023. This growth underscores Ericsson's strategic focus on telecommunications and 5G technology.
While the data for 2024 is incomplete for Ericsson, the trends from the previous years provide a compelling narrative of two industry titans navigating their unique paths.
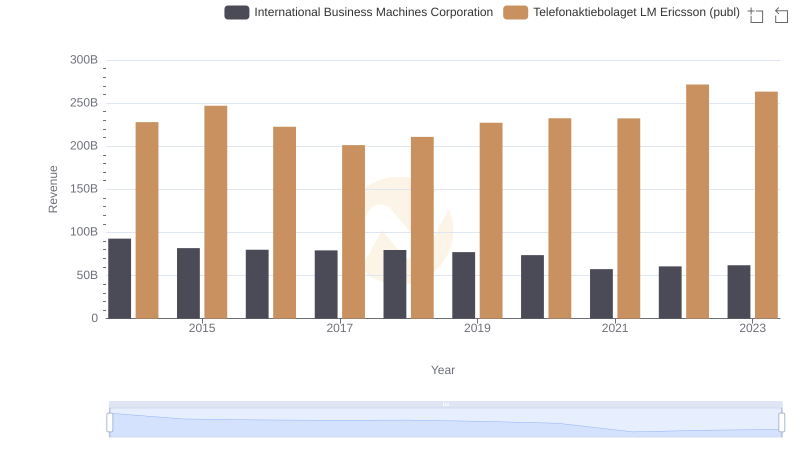
Comparing Revenue Performance: International Business Machines Corporation or Telefonaktiebolaget LM Ericsson (publ)?
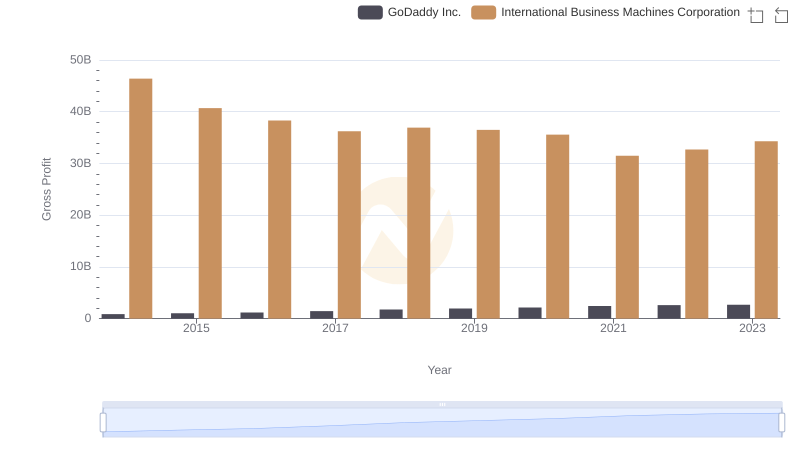
Gross Profit Comparison: International Business Machines Corporation and GoDaddy Inc. Trends
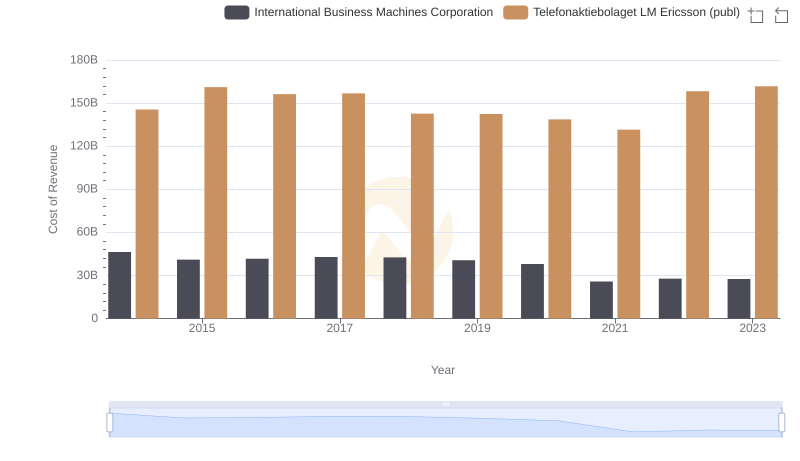
Cost of Revenue Trends: International Business Machines Corporation vs Telefonaktiebolaget LM Ericsson (publ)
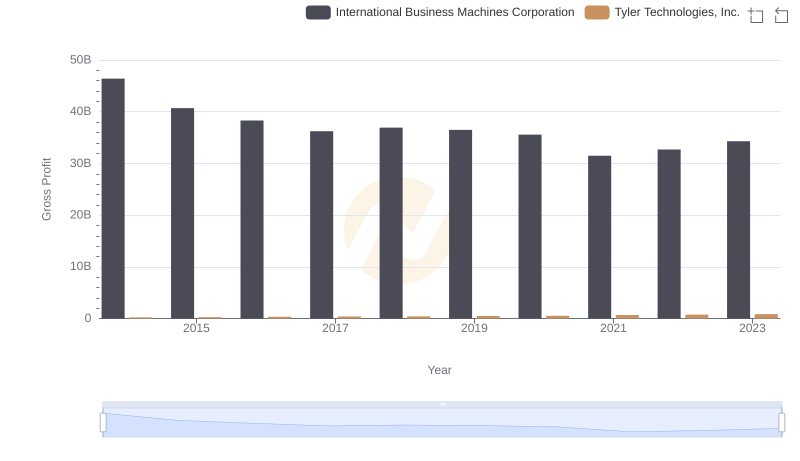
Gross Profit Analysis: Comparing International Business Machines Corporation and Tyler Technologies, Inc.
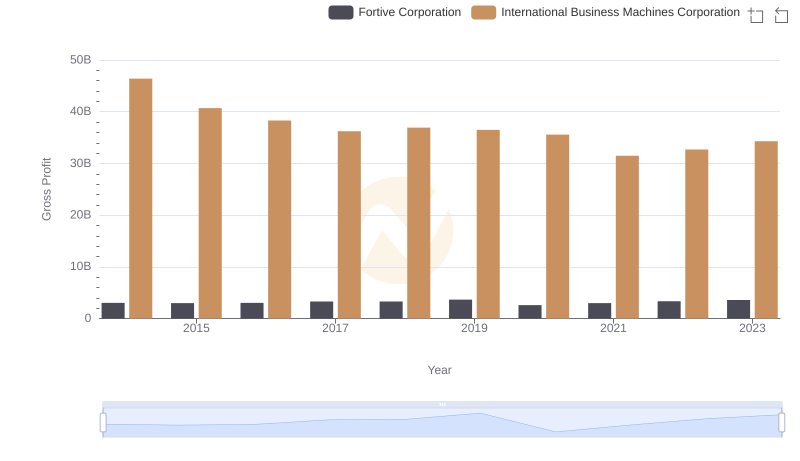
International Business Machines Corporation and Fortive Corporation: A Detailed Gross Profit Analysis
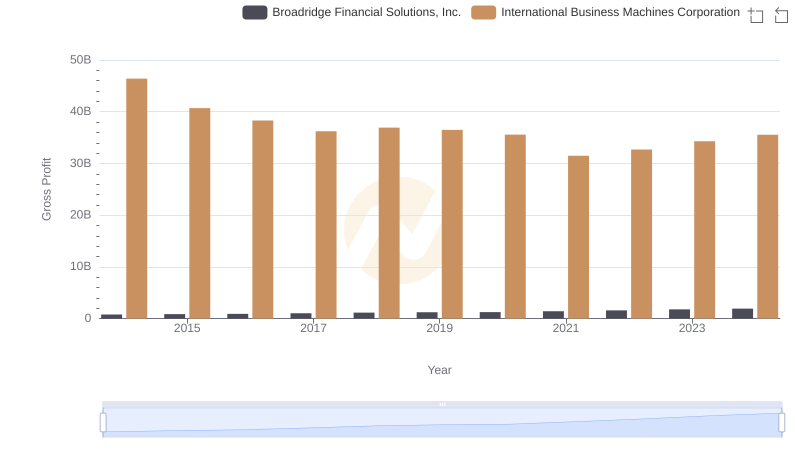
Gross Profit Trends Compared: International Business Machines Corporation vs Broadridge Financial Solutions, Inc.
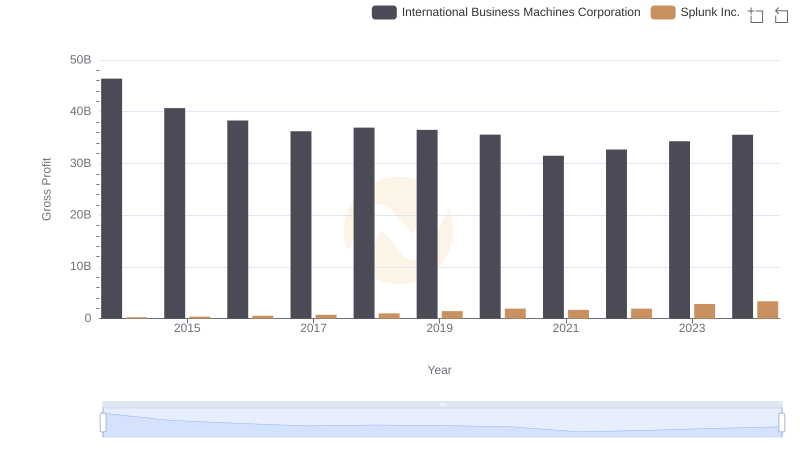
Gross Profit Trends Compared: International Business Machines Corporation vs Splunk Inc.
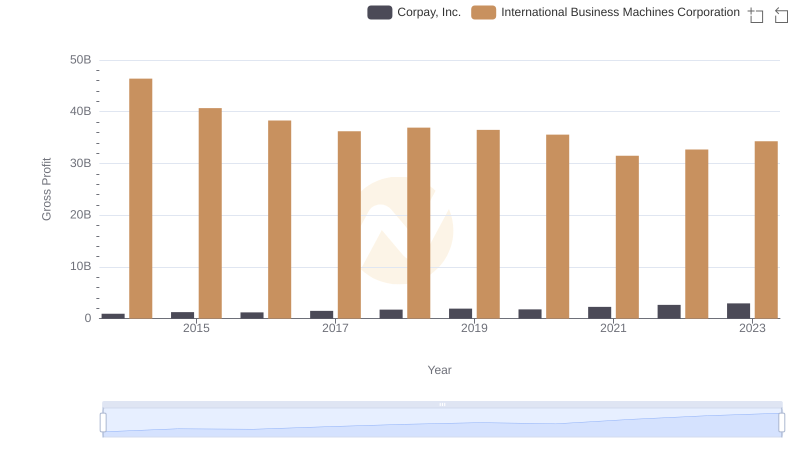
Who Generates Higher Gross Profit? International Business Machines Corporation or Corpay, Inc.
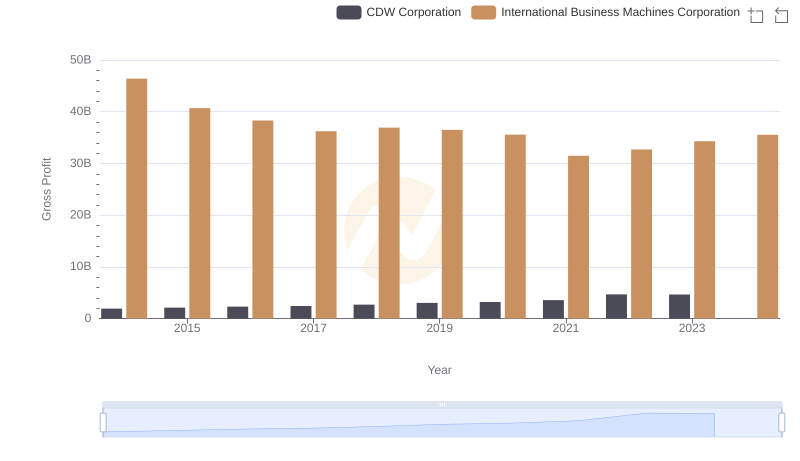
Gross Profit Comparison: International Business Machines Corporation and CDW Corporation Trends
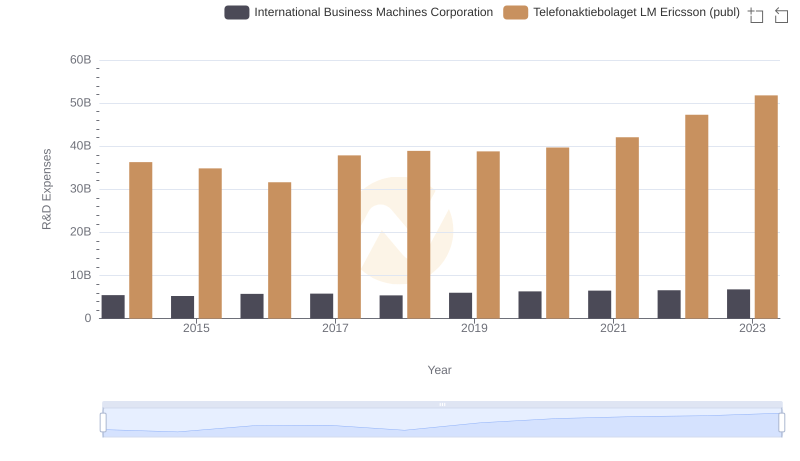
Analyzing R&D Budgets: International Business Machines Corporation vs Telefonaktiebolaget LM Ericsson (publ)
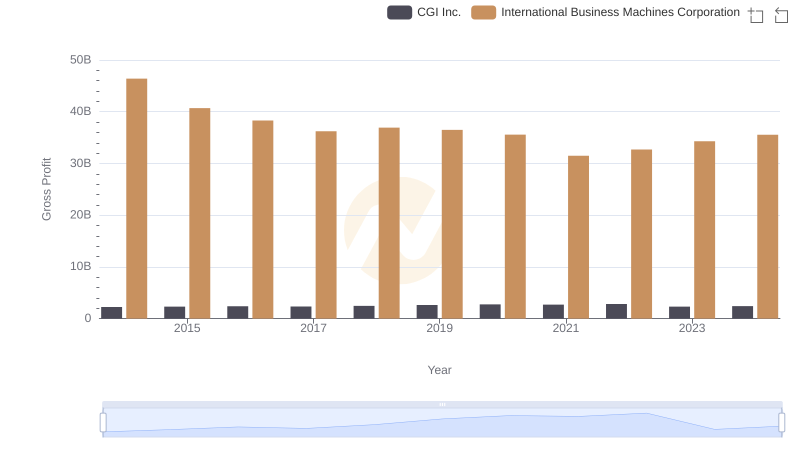
International Business Machines Corporation and CGI Inc.: A Detailed Gross Profit Analysis
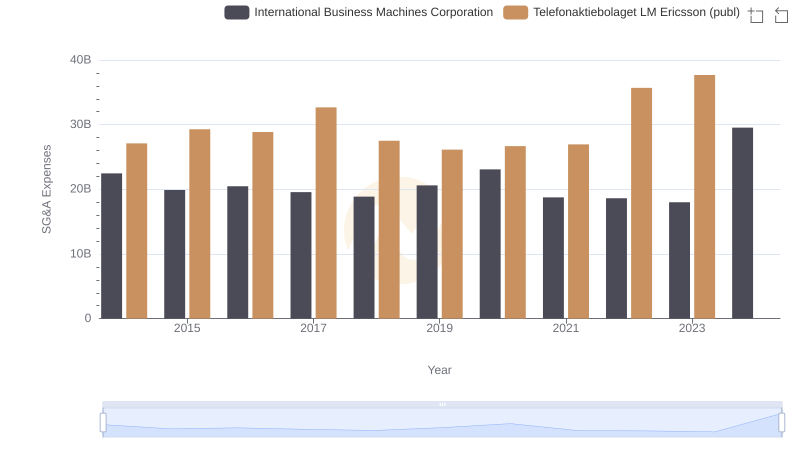
International Business Machines Corporation vs Telefonaktiebolaget LM Ericsson (publ): SG&A Expense Trends