| __timestamp | CDW Corporation | International Business Machines Corporation |
|---|---|---|
| Wednesday, January 1, 2014 | 1921300000 | 46407000000 |
| Thursday, January 1, 2015 | 2115800000 | 40684000000 |
| Friday, January 1, 2016 | 2327200000 | 38516000000 |
| Sunday, January 1, 2017 | 2449900000 | 36943000000 |
| Monday, January 1, 2018 | 2706900000 | 36936000000 |
| Tuesday, January 1, 2019 | 3039900000 | 31533000000 |
| Wednesday, January 1, 2020 | 3210100000 | 30865000000 |
| Friday, January 1, 2021 | 3568500000 | 31486000000 |
| Saturday, January 1, 2022 | 4686600000 | 32687000000 |
| Sunday, January 1, 2023 | 4652400001 | 34300000000 |
| Monday, January 1, 2024 | 4602400000 | 35551000000 |
Infusing magic into the data realm
In the ever-evolving landscape of technology and business solutions, International Business Machines Corporation (IBM) and CDW Corporation stand as titans. Over the past decade, these companies have showcased distinct trajectories in their gross profit margins. From 2014 to 2023, IBM's gross profit has seen a decline of approximately 26%, reflecting the challenges faced by traditional tech giants in adapting to new market dynamics. In contrast, CDW has experienced a remarkable growth of over 140% in the same period, highlighting its agile adaptation to the digital transformation wave.
While IBM's gross profit peaked in 2014, CDW's upward trend is a testament to its strategic positioning in the IT services sector. The data for 2024 remains incomplete, leaving room for speculation on future trends. As the tech industry continues to evolve, these insights provide a glimpse into the shifting sands of corporate profitability.
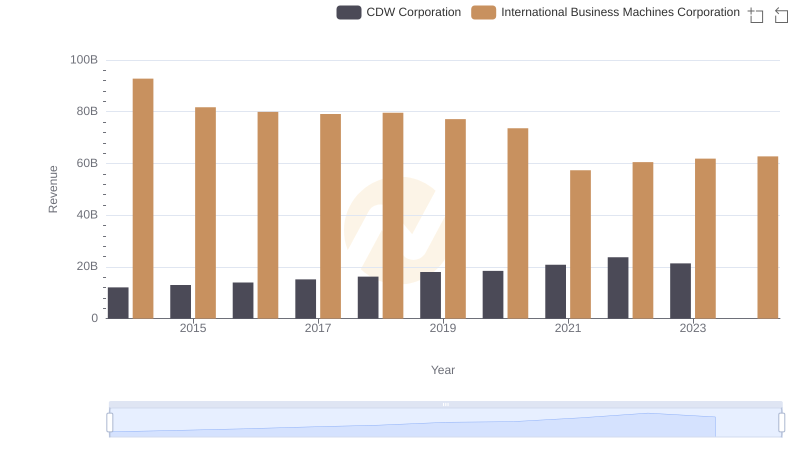
Who Generates More Revenue? International Business Machines Corporation or CDW Corporation
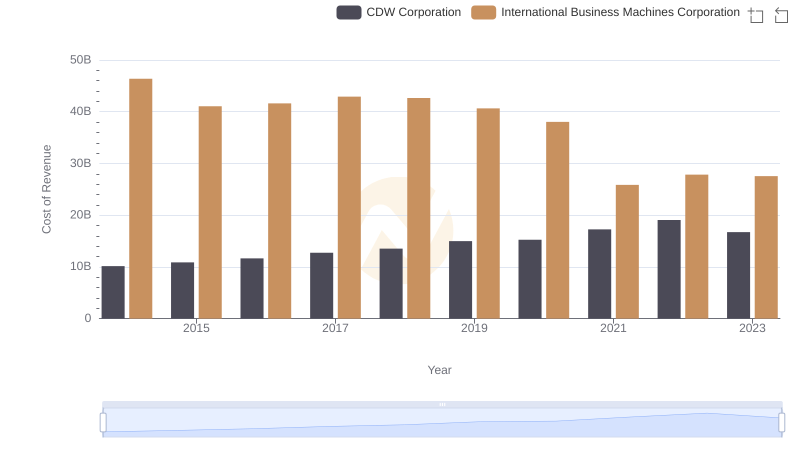
Analyzing Cost of Revenue: International Business Machines Corporation and CDW Corporation
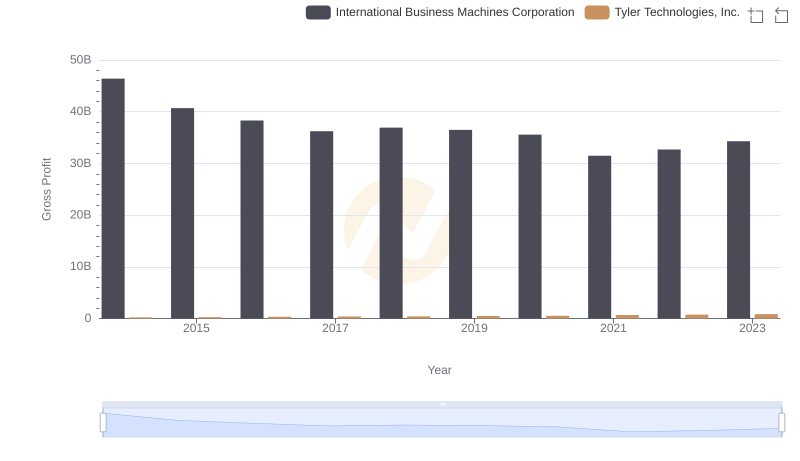
Gross Profit Analysis: Comparing International Business Machines Corporation and Tyler Technologies, Inc.
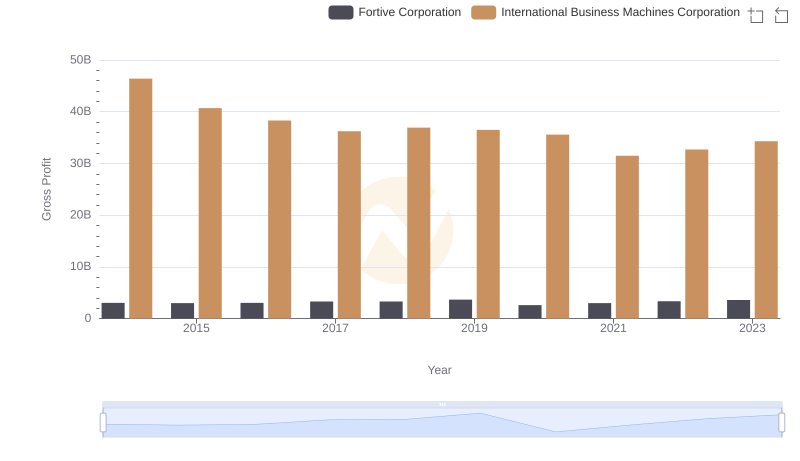
International Business Machines Corporation and Fortive Corporation: A Detailed Gross Profit Analysis
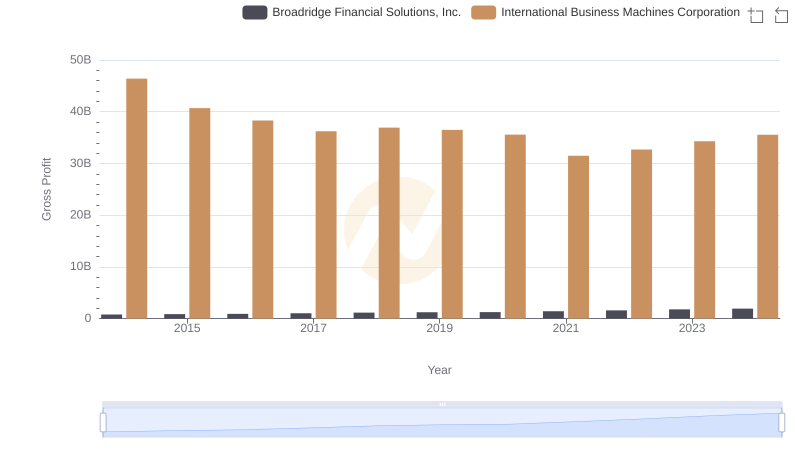
Gross Profit Trends Compared: International Business Machines Corporation vs Broadridge Financial Solutions, Inc.
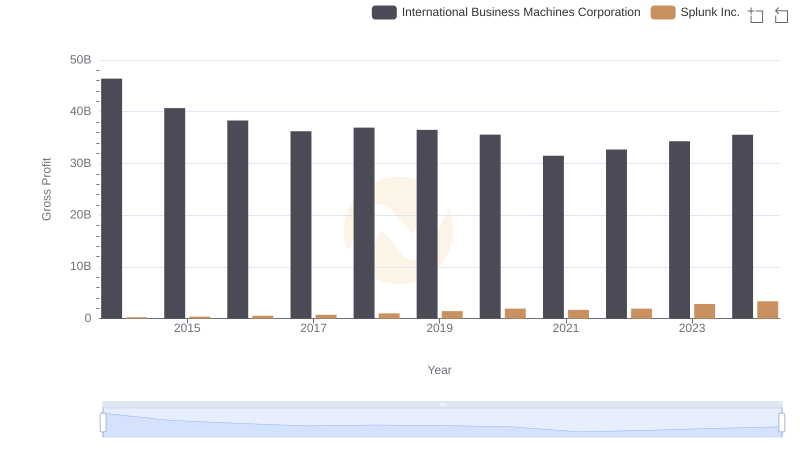
Gross Profit Trends Compared: International Business Machines Corporation vs Splunk Inc.
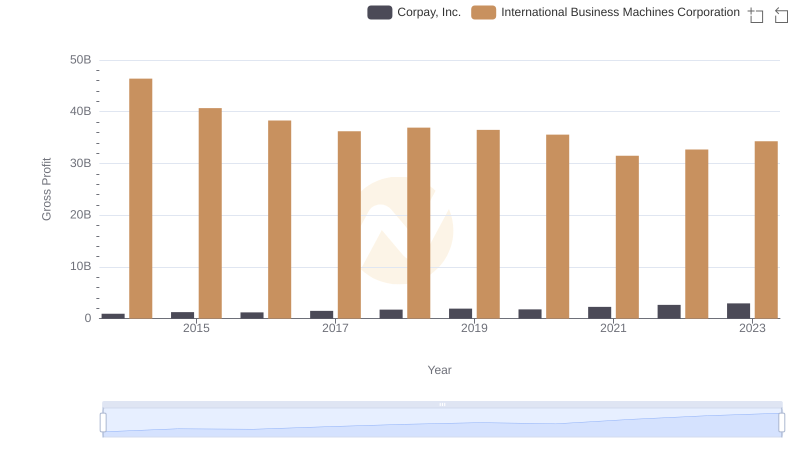
Who Generates Higher Gross Profit? International Business Machines Corporation or Corpay, Inc.
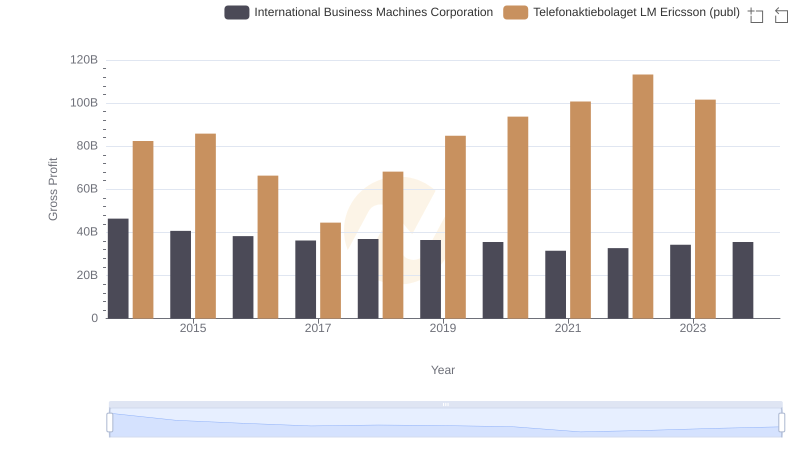
Key Insights on Gross Profit: International Business Machines Corporation vs Telefonaktiebolaget LM Ericsson (publ)
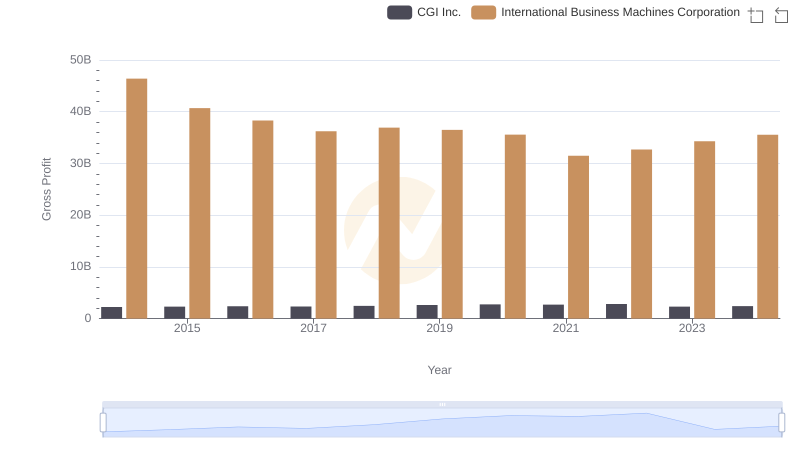
International Business Machines Corporation and CGI Inc.: A Detailed Gross Profit Analysis
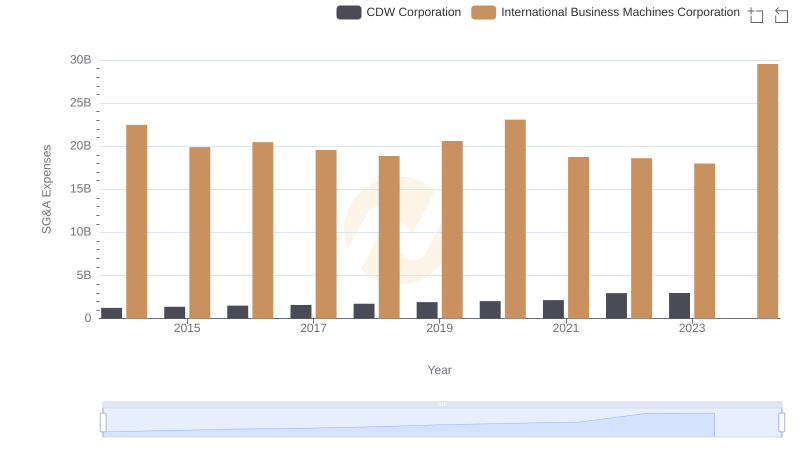
International Business Machines Corporation vs CDW Corporation: SG&A Expense Trends
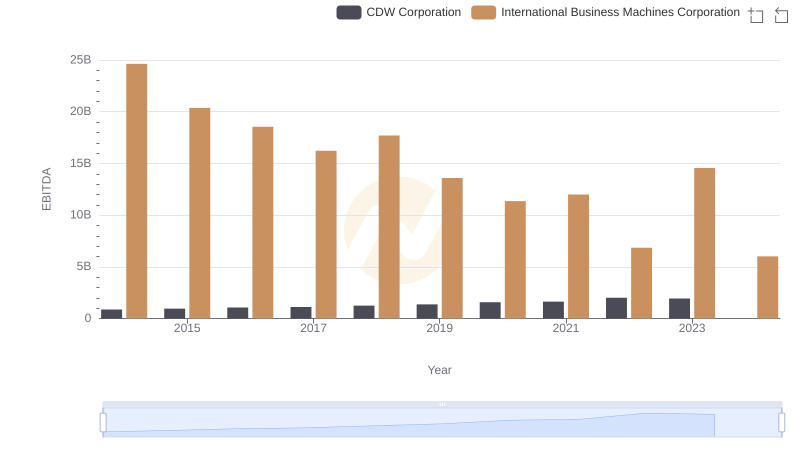
A Side-by-Side Analysis of EBITDA: International Business Machines Corporation and CDW Corporation
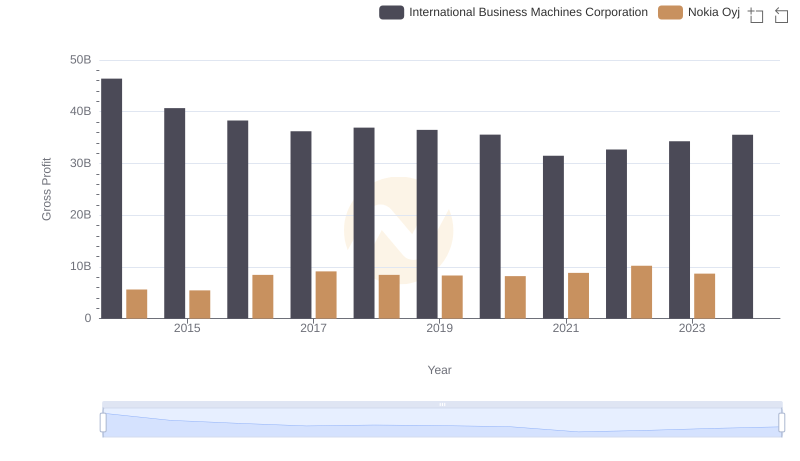
Gross Profit Comparison: International Business Machines Corporation and Nokia Oyj Trends