| __timestamp | Booz Allen Hamilton Holding Corporation | EMCOR Group, Inc. |
|---|---|---|
| Wednesday, January 1, 2014 | 2762580000 | 907246000 |
| Thursday, January 1, 2015 | 2680921000 | 944479000 |
| Friday, January 1, 2016 | 2825712000 | 1037862000 |
| Sunday, January 1, 2017 | 3112302000 | 1147012000 |
| Monday, January 1, 2018 | 3304750000 | 1205453000 |
| Tuesday, January 1, 2019 | 3603571000 | 1355868000 |
| Wednesday, January 1, 2020 | 4084661000 | 1395382000 |
| Friday, January 1, 2021 | 4201408000 | 1501737000 |
| Saturday, January 1, 2022 | 4464078000 | 1603594000 |
| Sunday, January 1, 2023 | 4954101000 | 2089339000 |
| Monday, January 1, 2024 | 2459049000 |
In pursuit of knowledge
In the competitive landscape of American business, understanding the financial health of companies is crucial. This analysis compares the gross profit trends of EMCOR Group, Inc. and Booz Allen Hamilton Holding Corporation from 2014 to 2023. Over this period, Booz Allen Hamilton's gross profit surged by approximately 79%, peaking in 2023. In contrast, EMCOR Group experienced a steady growth of around 130%, with its highest gross profit also recorded in 2023. Notably, Booz Allen Hamilton consistently outperformed EMCOR in absolute terms, but EMCOR's growth rate was more robust. The data for 2024 is incomplete, highlighting the need for ongoing analysis. These insights provide a window into the strategic financial maneuvers of these industry giants, offering valuable lessons for investors and analysts alike.
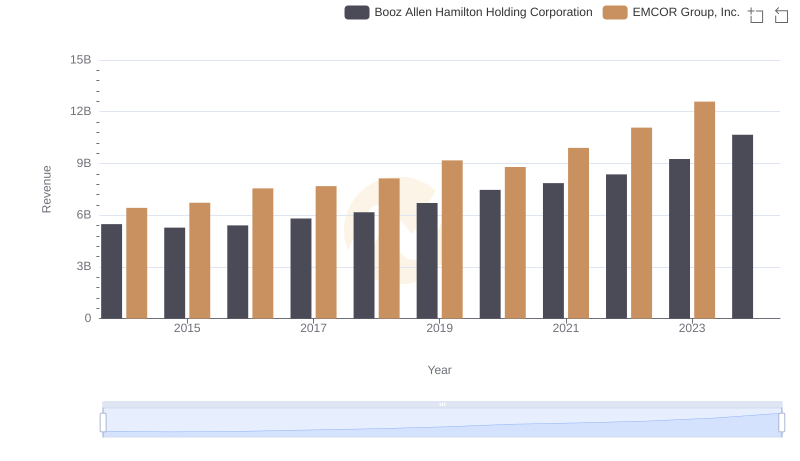
Revenue Insights: EMCOR Group, Inc. and Booz Allen Hamilton Holding Corporation Performance Compared
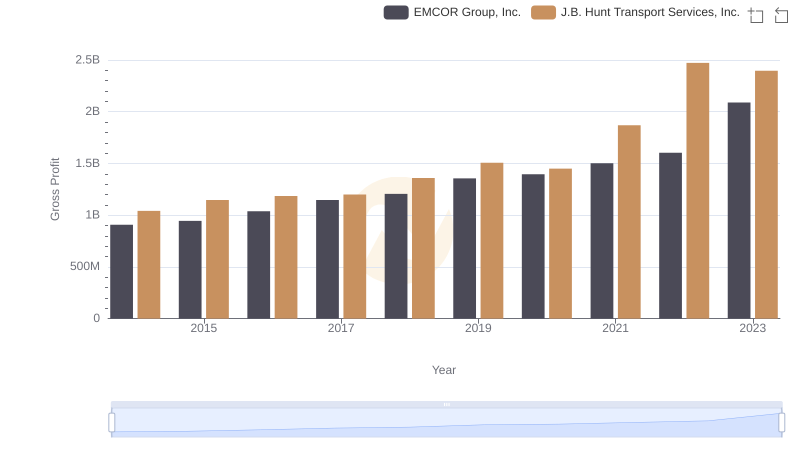
Gross Profit Trends Compared: EMCOR Group, Inc. vs J.B. Hunt Transport Services, Inc.
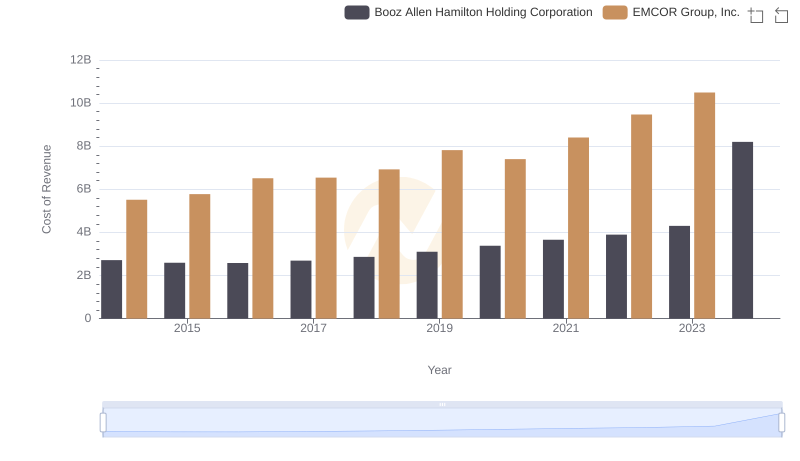
Cost of Revenue Trends: EMCOR Group, Inc. vs Booz Allen Hamilton Holding Corporation
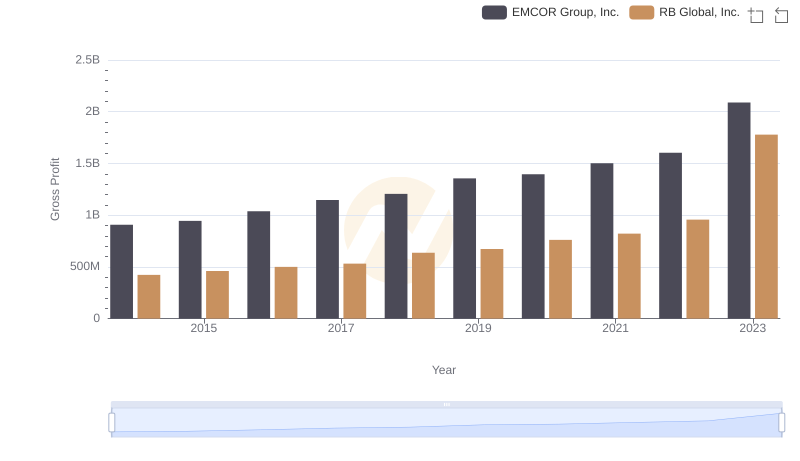
EMCOR Group, Inc. and RB Global, Inc.: A Detailed Gross Profit Analysis
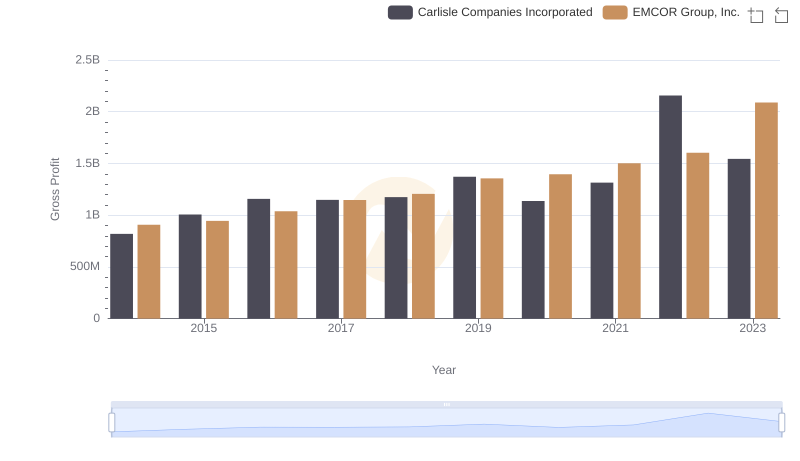
Gross Profit Trends Compared: EMCOR Group, Inc. vs Carlisle Companies Incorporated
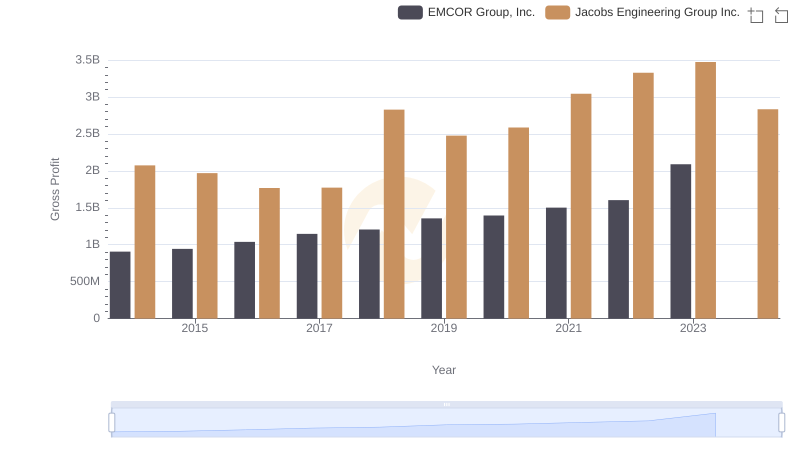
Who Generates Higher Gross Profit? EMCOR Group, Inc. or Jacobs Engineering Group Inc.
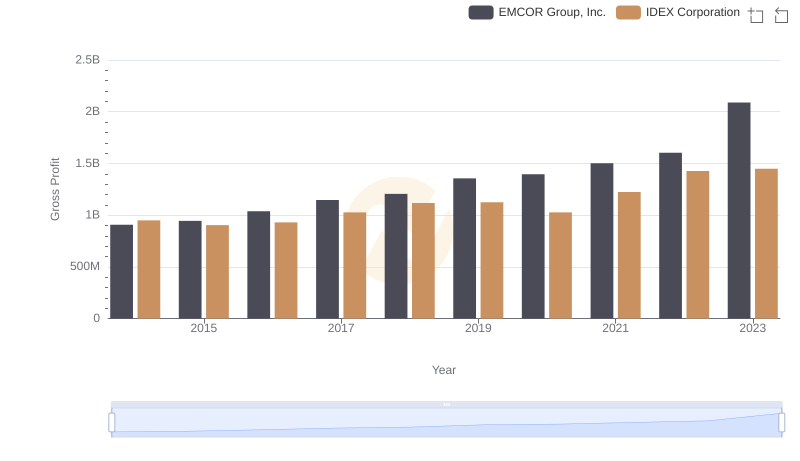
EMCOR Group, Inc. vs IDEX Corporation: A Gross Profit Performance Breakdown
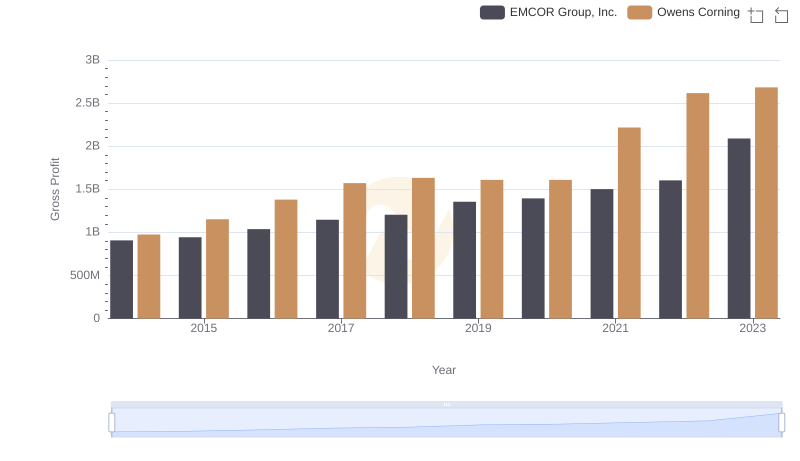
Gross Profit Trends Compared: EMCOR Group, Inc. vs Owens Corning
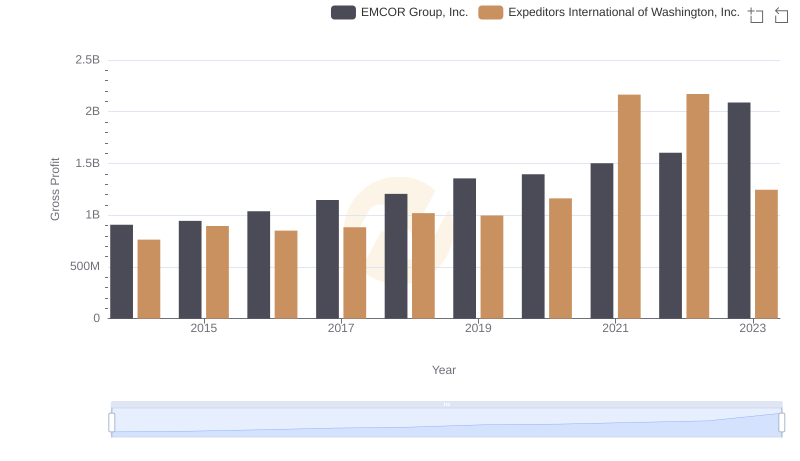
Gross Profit Analysis: Comparing EMCOR Group, Inc. and Expeditors International of Washington, Inc.
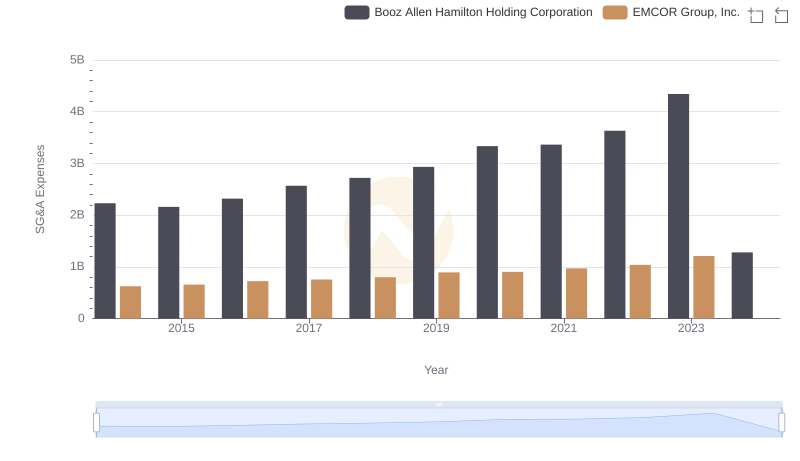
EMCOR Group, Inc. vs Booz Allen Hamilton Holding Corporation: SG&A Expense Trends
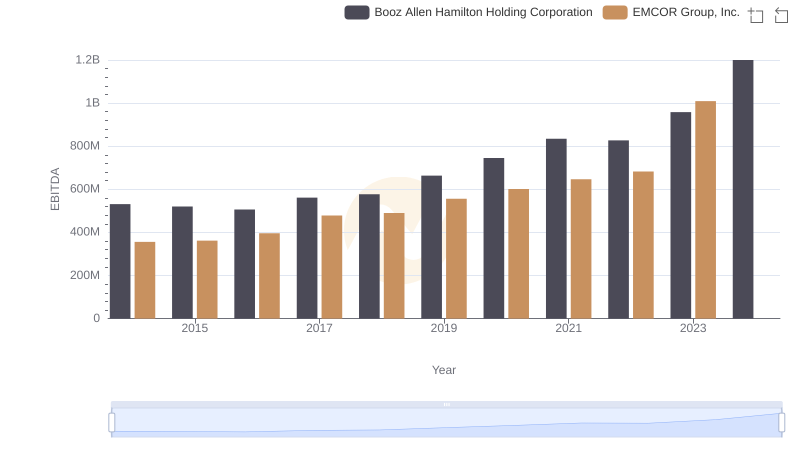
A Professional Review of EBITDA: EMCOR Group, Inc. Compared to Booz Allen Hamilton Holding Corporation