| __timestamp | EMCOR Group, Inc. | RB Global, Inc. |
|---|---|---|
| Wednesday, January 1, 2014 | 907246000 | 423213000 |
| Thursday, January 1, 2015 | 944479000 | 459849000 |
| Friday, January 1, 2016 | 1037862000 | 500333000 |
| Sunday, January 1, 2017 | 1147012000 | 531504000 |
| Monday, January 1, 2018 | 1205453000 | 636629000 |
| Tuesday, January 1, 2019 | 1355868000 | 672825000 |
| Wednesday, January 1, 2020 | 1395382000 | 761671000 |
| Friday, January 1, 2021 | 1501737000 | 822188000 |
| Saturday, January 1, 2022 | 1603594000 | 957107000 |
| Sunday, January 1, 2023 | 2089339000 | 1778400000 |
| Monday, January 1, 2024 | 4284200000 |
Data in motion
Over the past decade, EMCOR Group, Inc. and RB Global, Inc. have demonstrated remarkable growth in their gross profits. Starting in 2014, EMCOR's gross profit was approximately $907 million, while RB Global's was around $423 million. Fast forward to 2023, and EMCOR's gross profit surged by over 130% to reach $2.1 billion, while RB Global experienced an impressive 320% increase, reaching $1.78 billion.
This analysis highlights the robust financial health and strategic prowess of both companies, making them key players in their respective industries.
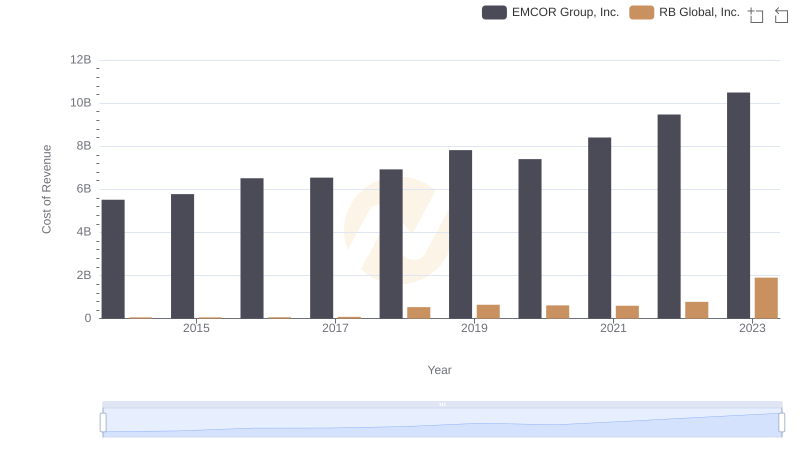
EMCOR Group, Inc. vs RB Global, Inc.: Efficiency in Cost of Revenue Explored
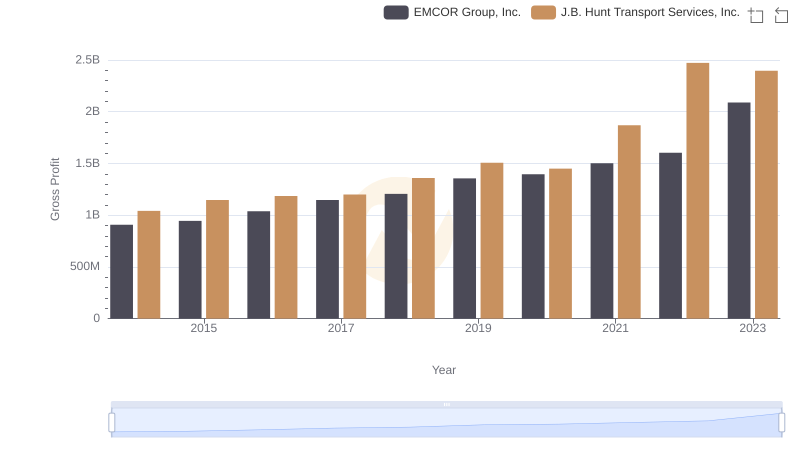
Gross Profit Trends Compared: EMCOR Group, Inc. vs J.B. Hunt Transport Services, Inc.
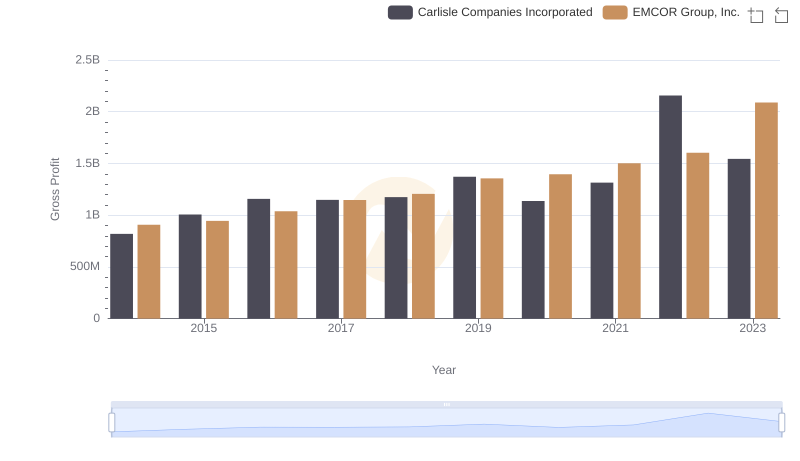
Gross Profit Trends Compared: EMCOR Group, Inc. vs Carlisle Companies Incorporated
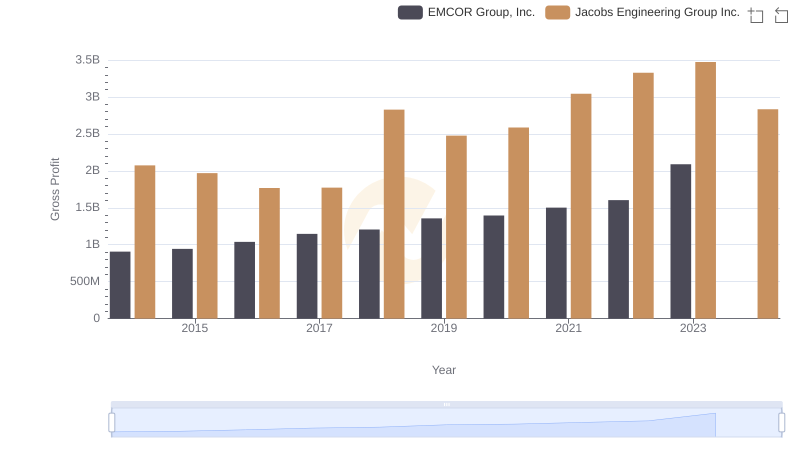
Who Generates Higher Gross Profit? EMCOR Group, Inc. or Jacobs Engineering Group Inc.
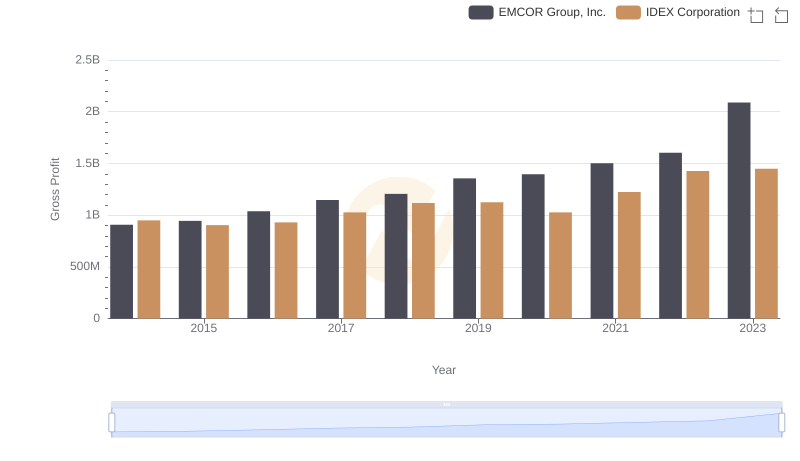
EMCOR Group, Inc. vs IDEX Corporation: A Gross Profit Performance Breakdown
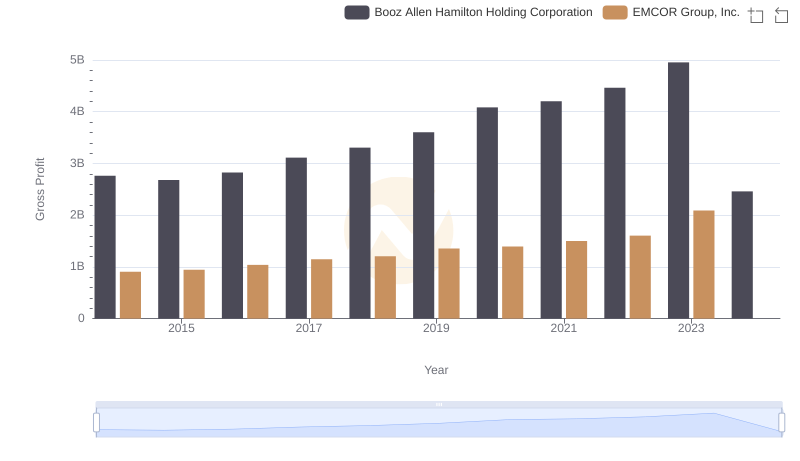
Gross Profit Trends Compared: EMCOR Group, Inc. vs Booz Allen Hamilton Holding Corporation
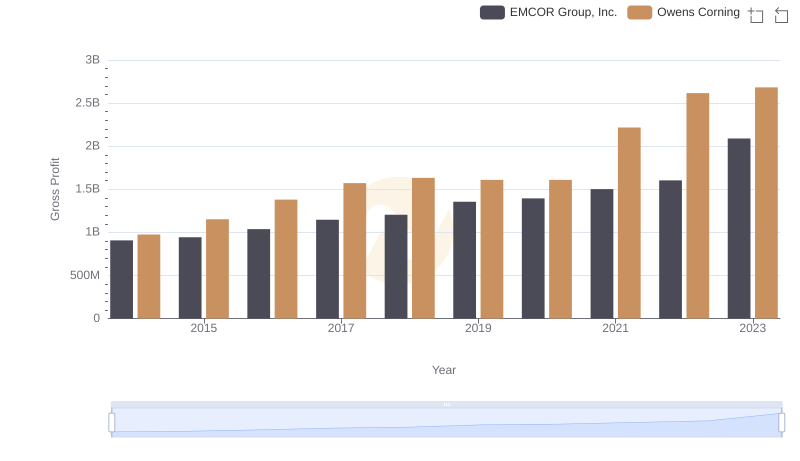
Gross Profit Trends Compared: EMCOR Group, Inc. vs Owens Corning
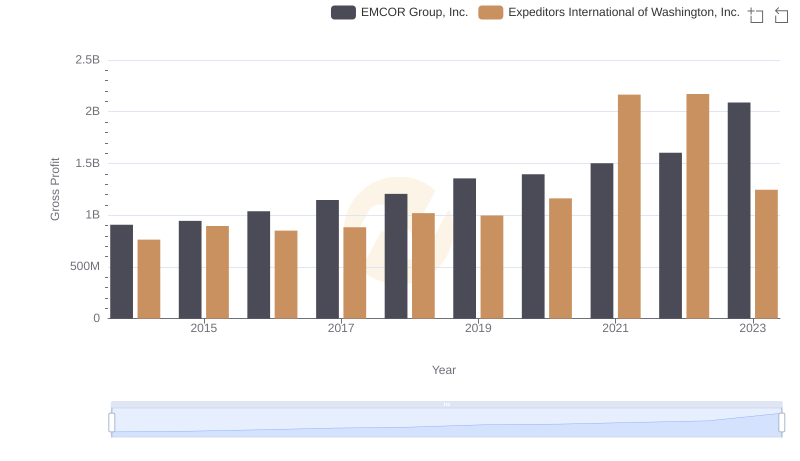
Gross Profit Analysis: Comparing EMCOR Group, Inc. and Expeditors International of Washington, Inc.
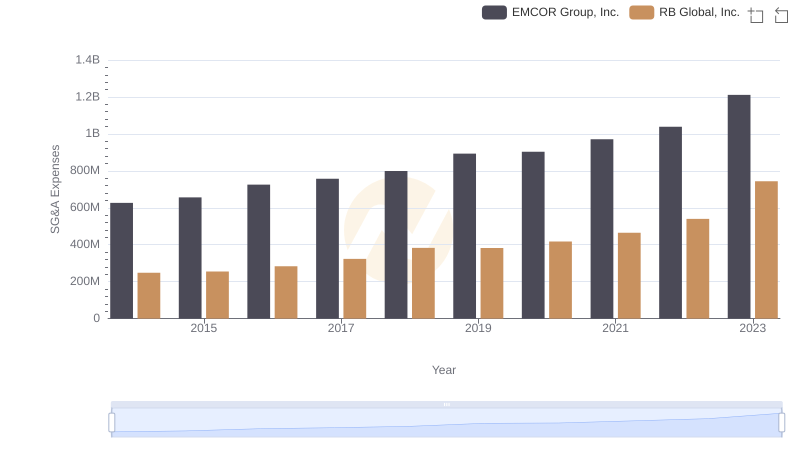
EMCOR Group, Inc. and RB Global, Inc.: SG&A Spending Patterns Compared