| __timestamp | EMCOR Group, Inc. | J.B. Hunt Transport Services, Inc. |
|---|---|---|
| Wednesday, January 1, 2014 | 907246000 | 1041346000 |
| Thursday, January 1, 2015 | 944479000 | 1146174000 |
| Friday, January 1, 2016 | 1037862000 | 1185633000 |
| Sunday, January 1, 2017 | 1147012000 | 1199293000 |
| Monday, January 1, 2018 | 1205453000 | 1359217000 |
| Tuesday, January 1, 2019 | 1355868000 | 1506255000 |
| Wednesday, January 1, 2020 | 1395382000 | 1449876000 |
| Friday, January 1, 2021 | 1501737000 | 1869819000 |
| Saturday, January 1, 2022 | 1603594000 | 2472527000 |
| Sunday, January 1, 2023 | 2089339000 | 2396388000 |
Igniting the spark of knowledge
In the ever-evolving landscape of American industry, EMCOR Group, Inc. and J.B. Hunt Transport Services, Inc. have emerged as formidable players. Over the past decade, from 2014 to 2023, both companies have demonstrated impressive growth in gross profit, reflecting their strategic prowess and market adaptability.
EMCOR Group, Inc. has seen its gross profit soar by approximately 130%, starting from $907 million in 2014 to a remarkable $2.09 billion in 2023. This growth underscores EMCOR's robust operational strategies and its ability to capitalize on market opportunities.
Meanwhile, J.B. Hunt Transport Services, Inc. has not lagged behind. The company experienced a 130% increase in gross profit, climbing from $1.04 billion in 2014 to $2.40 billion in 2023. This trajectory highlights J.B. Hunt's innovative logistics solutions and its commitment to customer satisfaction.
Both companies have navigated economic fluctuations with resilience, showcasing their leadership in their respective sectors.
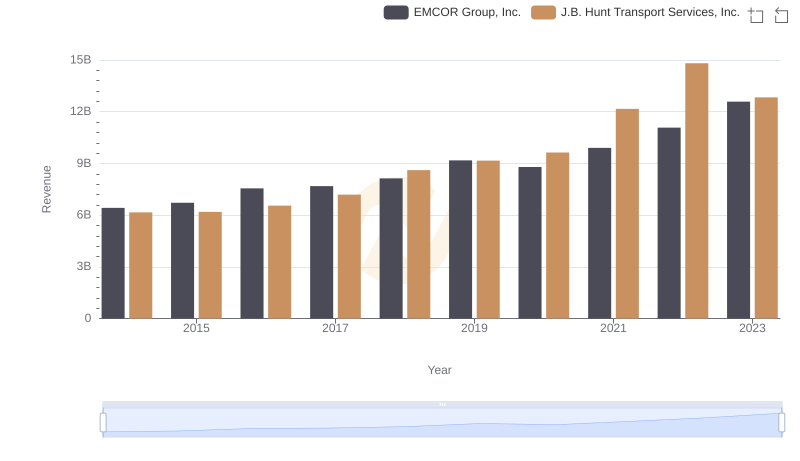
Annual Revenue Comparison: EMCOR Group, Inc. vs J.B. Hunt Transport Services, Inc.
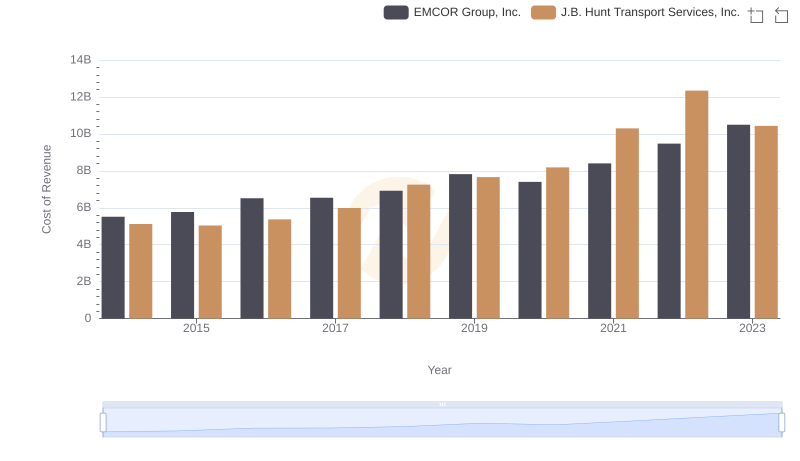
Cost of Revenue: Key Insights for EMCOR Group, Inc. and J.B. Hunt Transport Services, Inc.
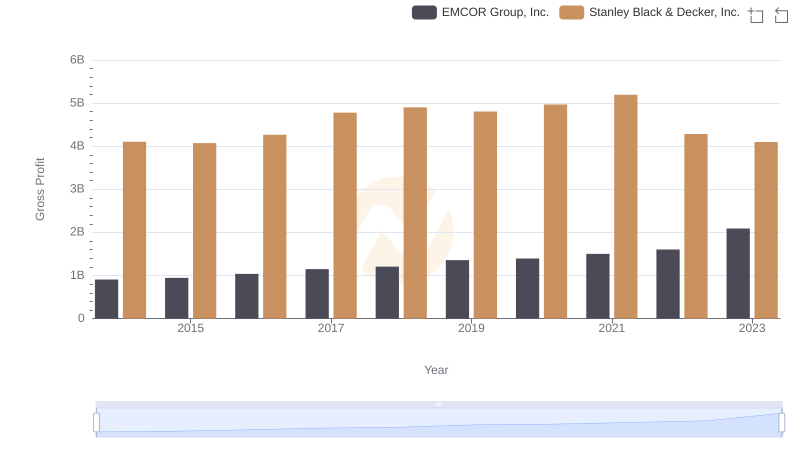
Key Insights on Gross Profit: EMCOR Group, Inc. vs Stanley Black & Decker, Inc.
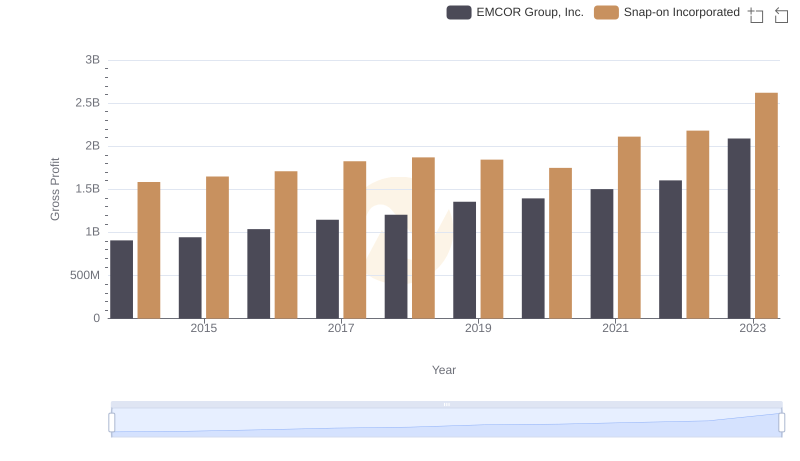
Gross Profit Comparison: EMCOR Group, Inc. and Snap-on Incorporated Trends
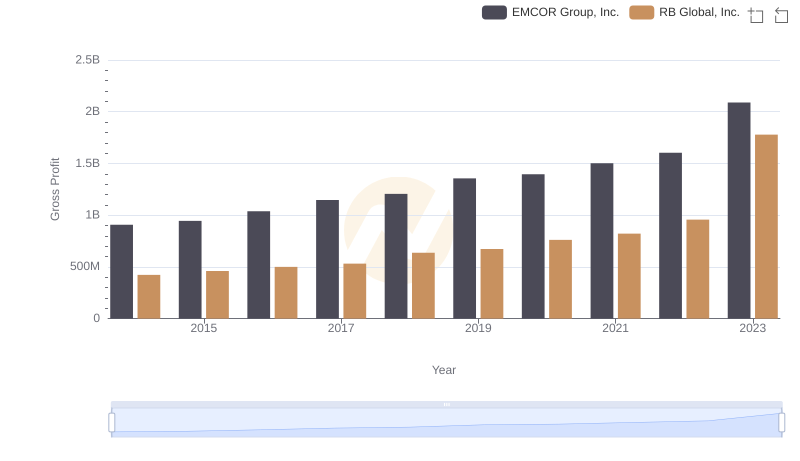
EMCOR Group, Inc. and RB Global, Inc.: A Detailed Gross Profit Analysis
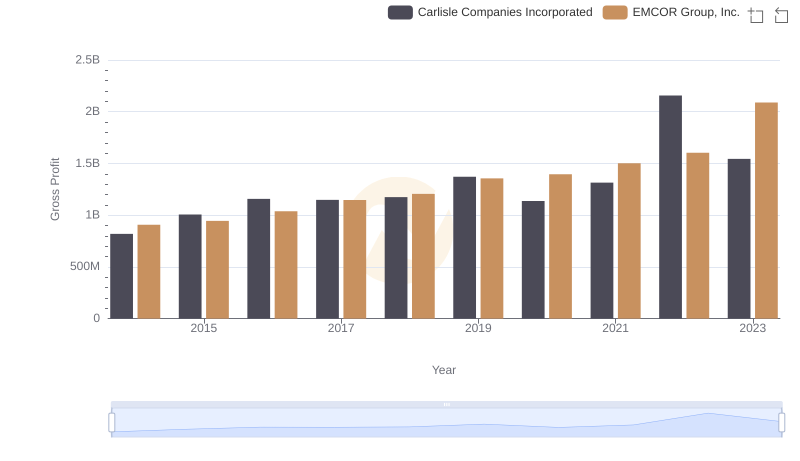
Gross Profit Trends Compared: EMCOR Group, Inc. vs Carlisle Companies Incorporated
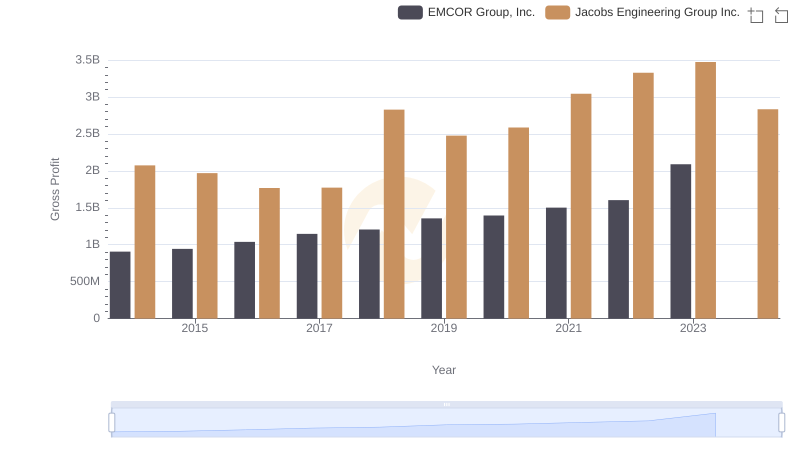
Who Generates Higher Gross Profit? EMCOR Group, Inc. or Jacobs Engineering Group Inc.
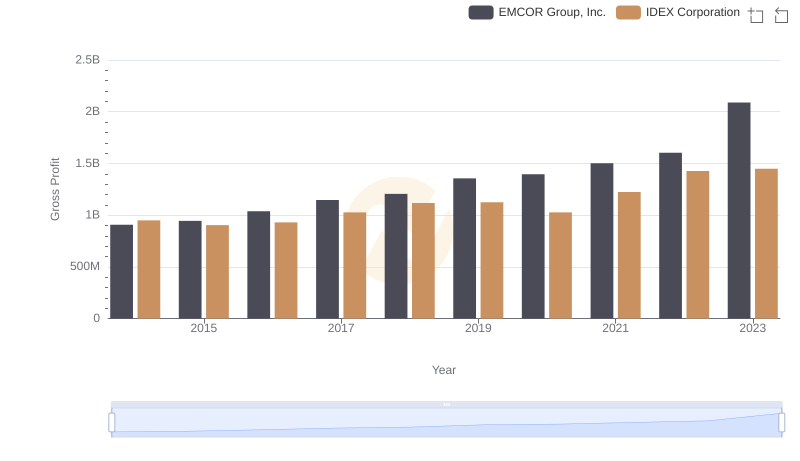
EMCOR Group, Inc. vs IDEX Corporation: A Gross Profit Performance Breakdown

Breaking Down SG&A Expenses: EMCOR Group, Inc. vs J.B. Hunt Transport Services, Inc.
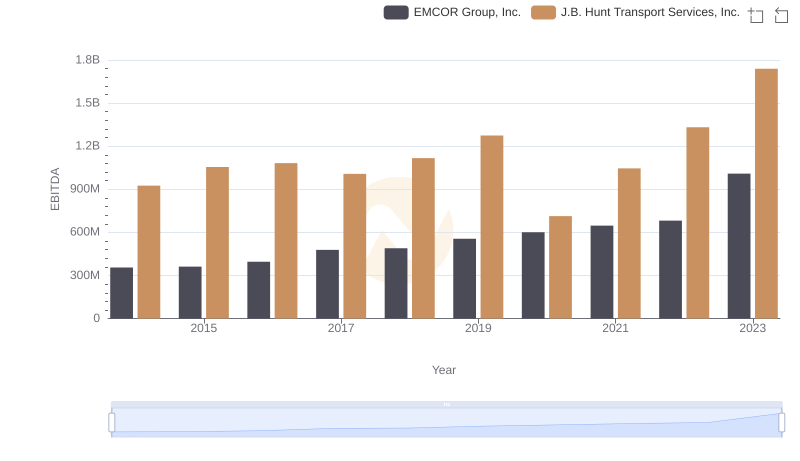
Comparative EBITDA Analysis: EMCOR Group, Inc. vs J.B. Hunt Transport Services, Inc.