| __timestamp | EMCOR Group, Inc. | IDEX Corporation |
|---|---|---|
| Wednesday, January 1, 2014 | 907246000 | 949315000 |
| Thursday, January 1, 2015 | 944479000 | 904315000 |
| Friday, January 1, 2016 | 1037862000 | 930767000 |
| Sunday, January 1, 2017 | 1147012000 | 1026678000 |
| Monday, January 1, 2018 | 1205453000 | 1117895000 |
| Tuesday, January 1, 2019 | 1355868000 | 1125034000 |
| Wednesday, January 1, 2020 | 1395382000 | 1027424000 |
| Friday, January 1, 2021 | 1501737000 | 1224500000 |
| Saturday, January 1, 2022 | 1603594000 | 1426900000 |
| Sunday, January 1, 2023 | 2089339000 | 1448500000 |
| Monday, January 1, 2024 | 1454800000 |
Igniting the spark of knowledge
In the competitive landscape of industrial services and manufacturing, EMCOR Group, Inc. and IDEX Corporation have demonstrated remarkable resilience and growth over the past decade. From 2014 to 2023, EMCOR's gross profit surged by approximately 130%, peaking at over $2 billion in 2023. This impressive growth reflects EMCOR's strategic expansions and operational efficiencies.
Meanwhile, IDEX Corporation, known for its innovative fluid and metering technologies, also experienced a steady increase in gross profit, growing by about 53% during the same period. By 2023, IDEX's gross profit reached nearly $1.45 billion, underscoring its robust market position.
This performance breakdown highlights the dynamic nature of these industry leaders, with EMCOR consistently outpacing IDEX in gross profit growth. As both companies continue to innovate and expand, their financial trajectories offer valuable insights into the evolving industrial sector.
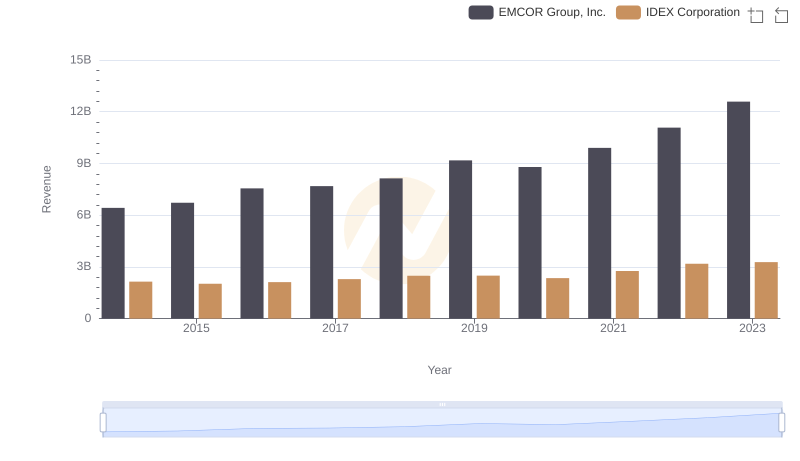
Comparing Revenue Performance: EMCOR Group, Inc. or IDEX Corporation?
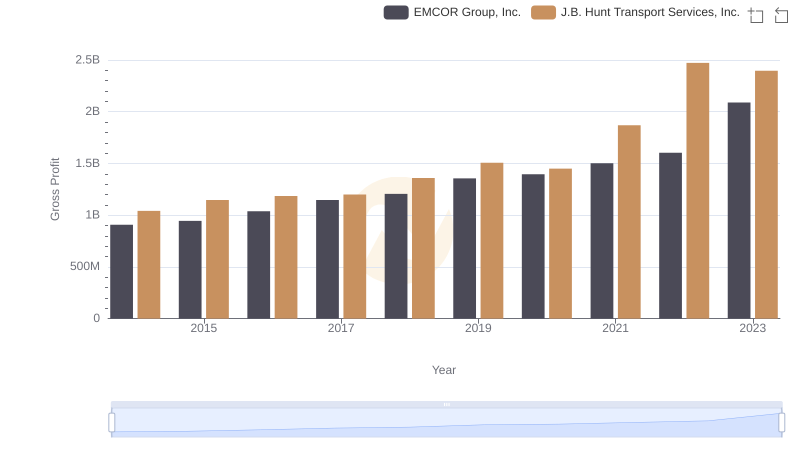
Gross Profit Trends Compared: EMCOR Group, Inc. vs J.B. Hunt Transport Services, Inc.
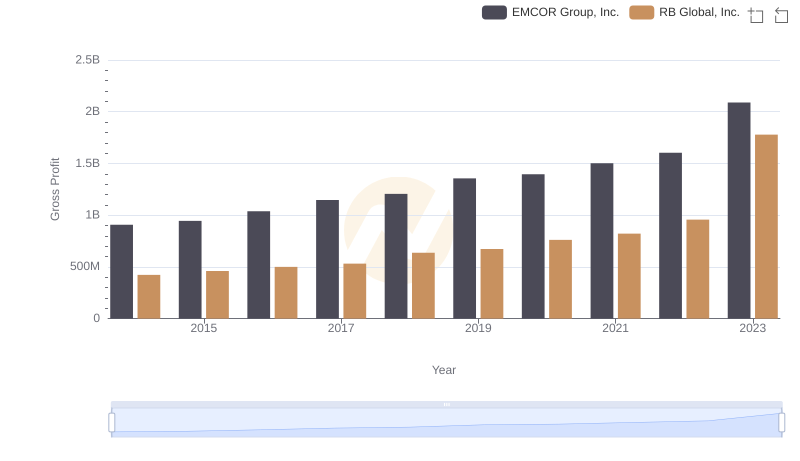
EMCOR Group, Inc. and RB Global, Inc.: A Detailed Gross Profit Analysis
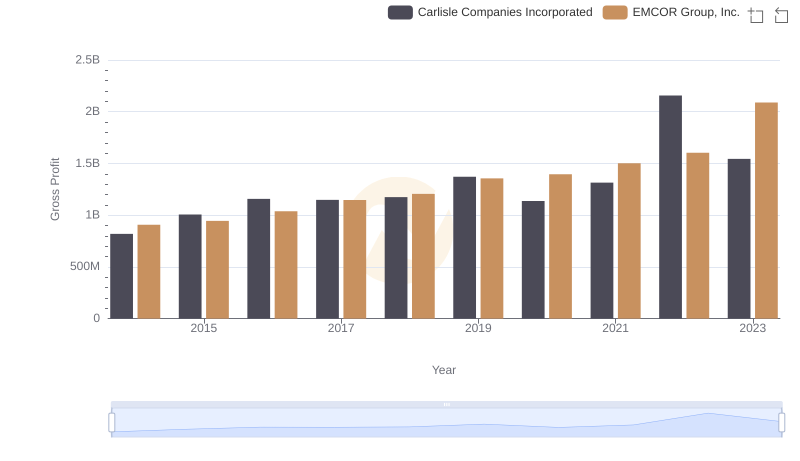
Gross Profit Trends Compared: EMCOR Group, Inc. vs Carlisle Companies Incorporated
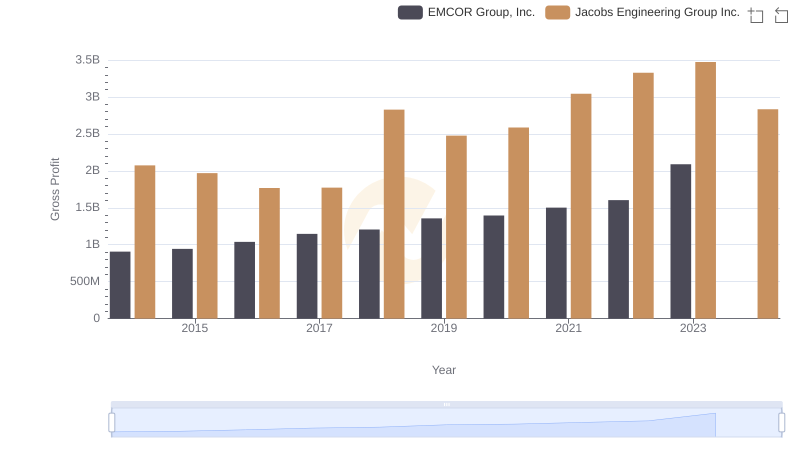
Who Generates Higher Gross Profit? EMCOR Group, Inc. or Jacobs Engineering Group Inc.
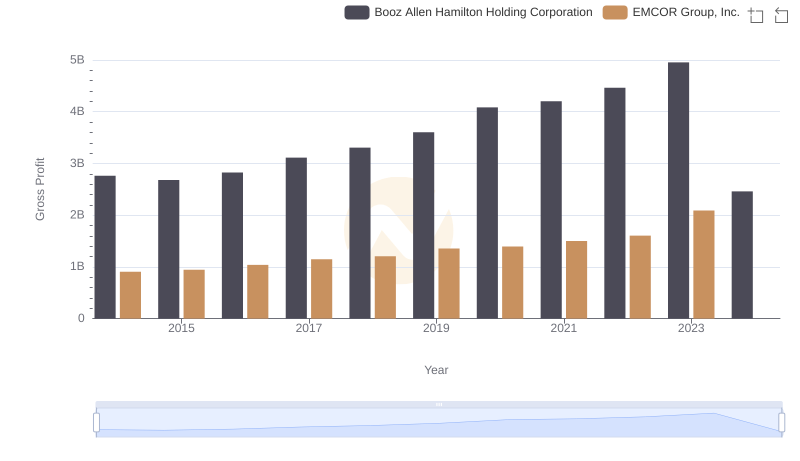
Gross Profit Trends Compared: EMCOR Group, Inc. vs Booz Allen Hamilton Holding Corporation
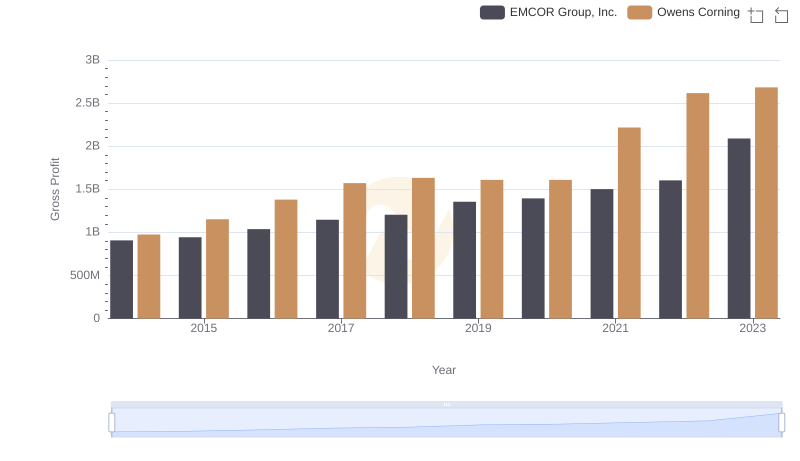
Gross Profit Trends Compared: EMCOR Group, Inc. vs Owens Corning
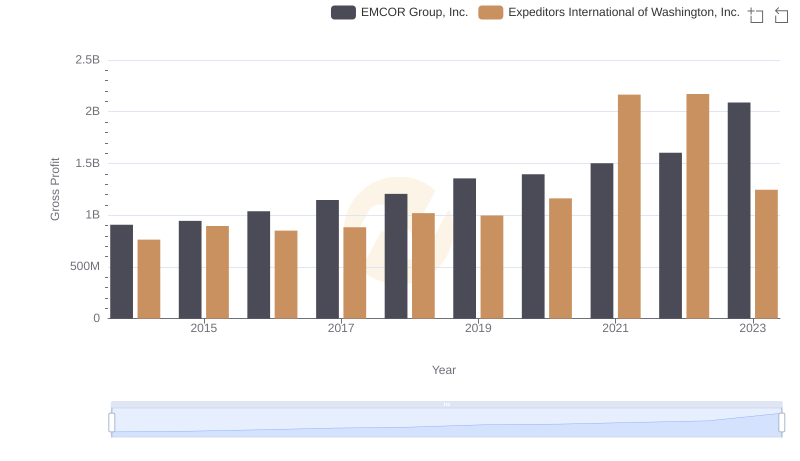
Gross Profit Analysis: Comparing EMCOR Group, Inc. and Expeditors International of Washington, Inc.
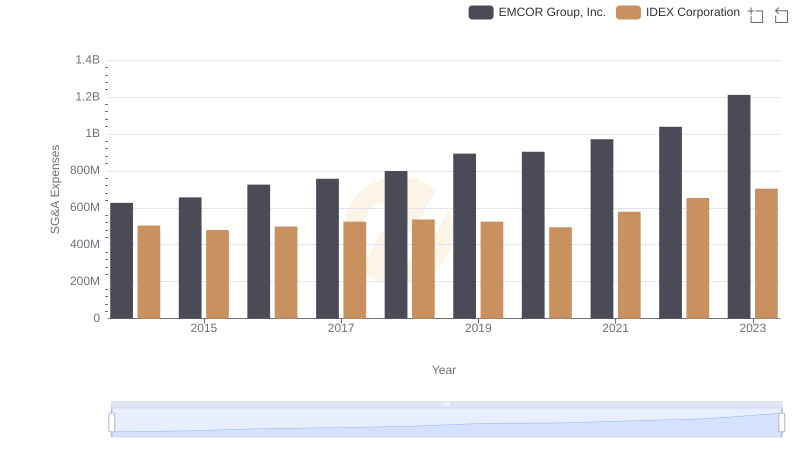
Breaking Down SG&A Expenses: EMCOR Group, Inc. vs IDEX Corporation
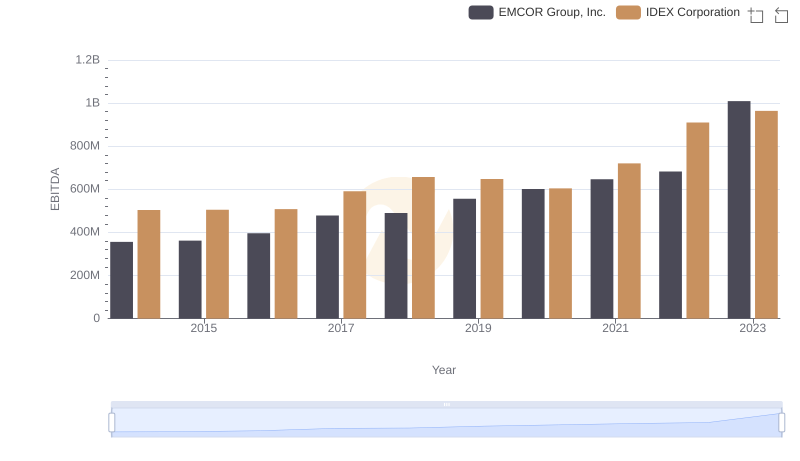
EBITDA Performance Review: EMCOR Group, Inc. vs IDEX Corporation