| __timestamp | Booz Allen Hamilton Holding Corporation | EMCOR Group, Inc. |
|---|---|---|
| Wednesday, January 1, 2014 | 5478693000 | 6424965000 |
| Thursday, January 1, 2015 | 5274770000 | 6718726000 |
| Friday, January 1, 2016 | 5405738000 | 7551524000 |
| Sunday, January 1, 2017 | 5804284000 | 7686999000 |
| Monday, January 1, 2018 | 6171853000 | 8130631000 |
| Tuesday, January 1, 2019 | 6704037000 | 9174611000 |
| Wednesday, January 1, 2020 | 7463841000 | 8797061000 |
| Friday, January 1, 2021 | 7858938000 | 9903580000 |
| Saturday, January 1, 2022 | 8363700000 | 11076120000 |
| Sunday, January 1, 2023 | 9258911000 | 12582873000 |
| Monday, January 1, 2024 | 10661896000 |
In pursuit of knowledge
In the competitive landscape of the U.S. stock market, EMCOR Group, Inc. and Booz Allen Hamilton Holding Corporation have shown remarkable revenue growth over the past decade. From 2014 to 2023, EMCOR's revenue surged by approximately 96%, reaching its peak in 2023 with a revenue of $12.6 billion. Meanwhile, Booz Allen Hamilton experienced a robust 94% increase, culminating in a revenue of $10.7 billion in 2024.
This growth trajectory highlights the resilience and strategic prowess of both companies. EMCOR's consistent upward trend, despite a slight dip in 2020, underscores its adaptability in a fluctuating market. Booz Allen Hamilton, on the other hand, maintained a steady climb, reflecting its stronghold in the consulting sector.
While EMCOR's data for 2024 is missing, the overall trend suggests a continued positive outlook for both industry giants.
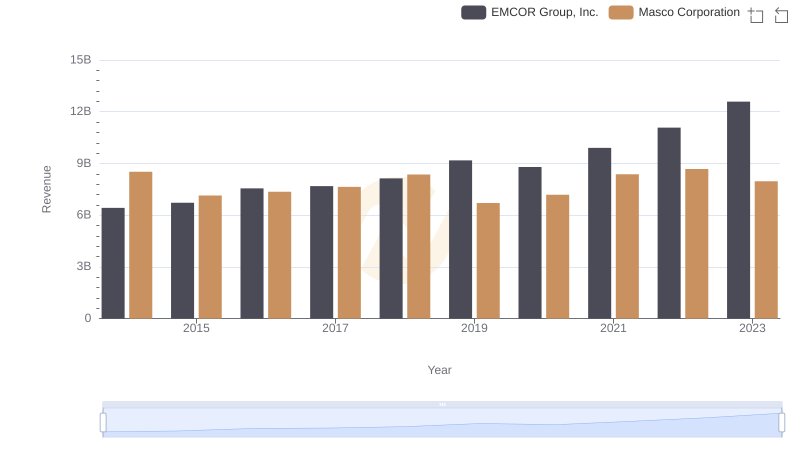
EMCOR Group, Inc. and Masco Corporation: A Comprehensive Revenue Analysis
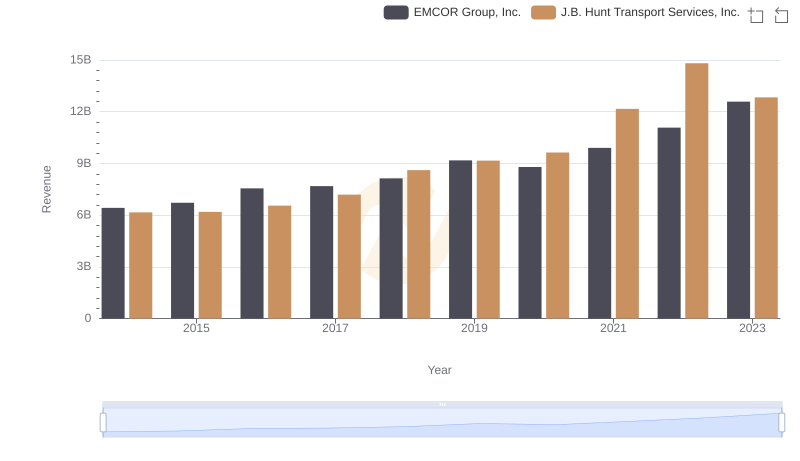
Annual Revenue Comparison: EMCOR Group, Inc. vs J.B. Hunt Transport Services, Inc.
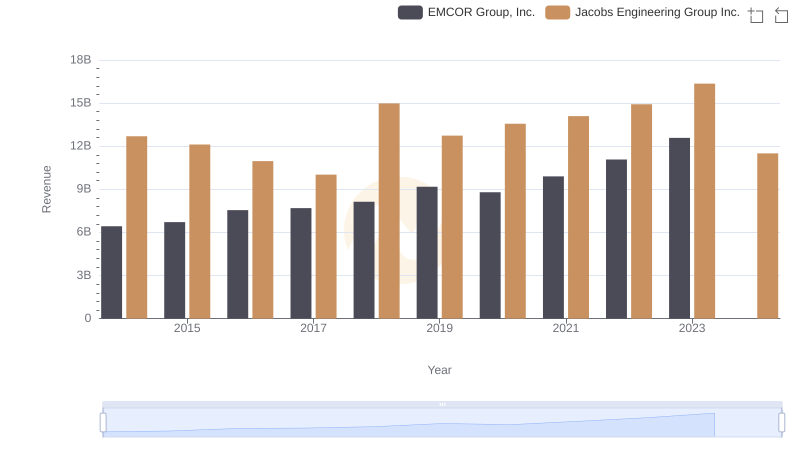
EMCOR Group, Inc. vs Jacobs Engineering Group Inc.: Examining Key Revenue Metrics
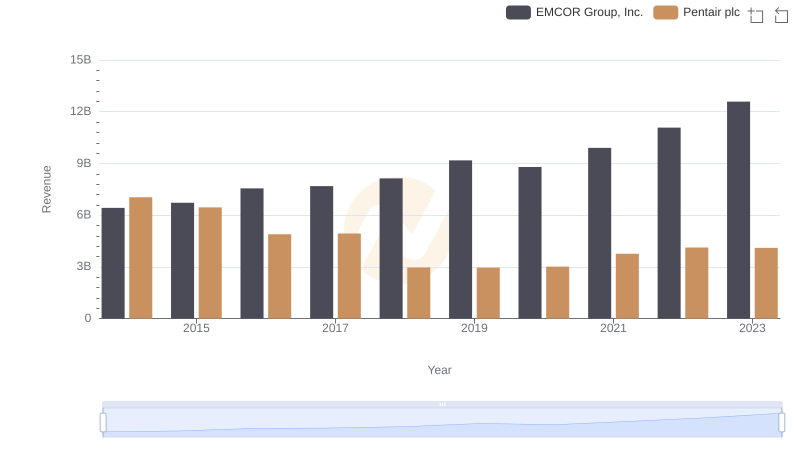
Revenue Insights: EMCOR Group, Inc. and Pentair plc Performance Compared
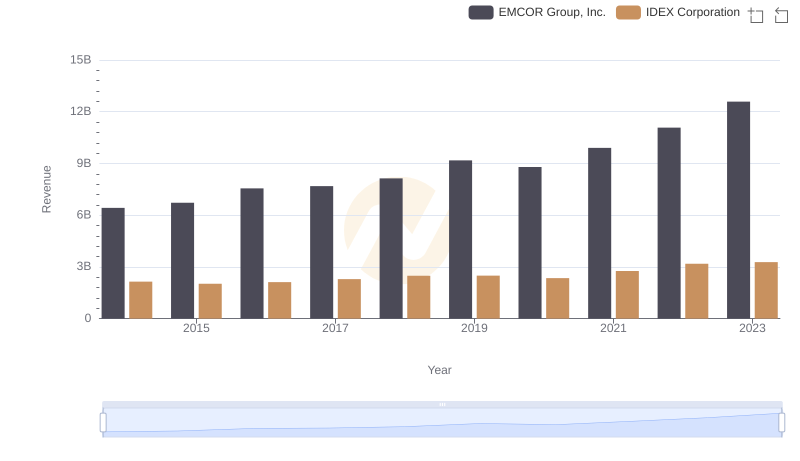
Comparing Revenue Performance: EMCOR Group, Inc. or IDEX Corporation?
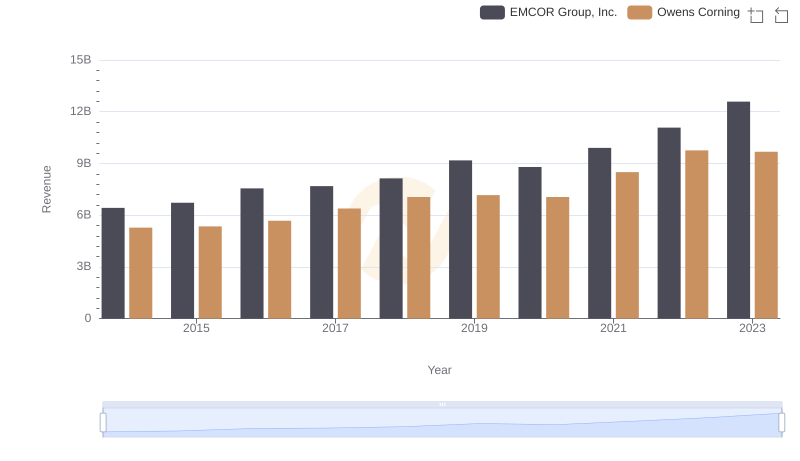
EMCOR Group, Inc. vs Owens Corning: Examining Key Revenue Metrics
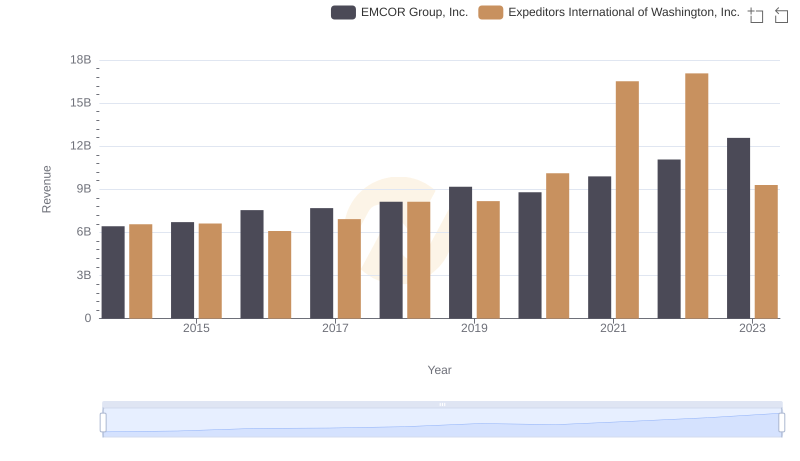
EMCOR Group, Inc. or Expeditors International of Washington, Inc.: Who Leads in Yearly Revenue?
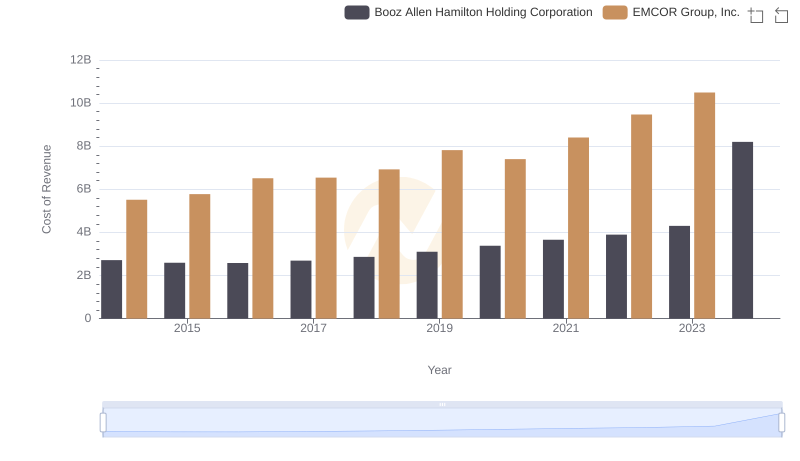
Cost of Revenue Trends: EMCOR Group, Inc. vs Booz Allen Hamilton Holding Corporation
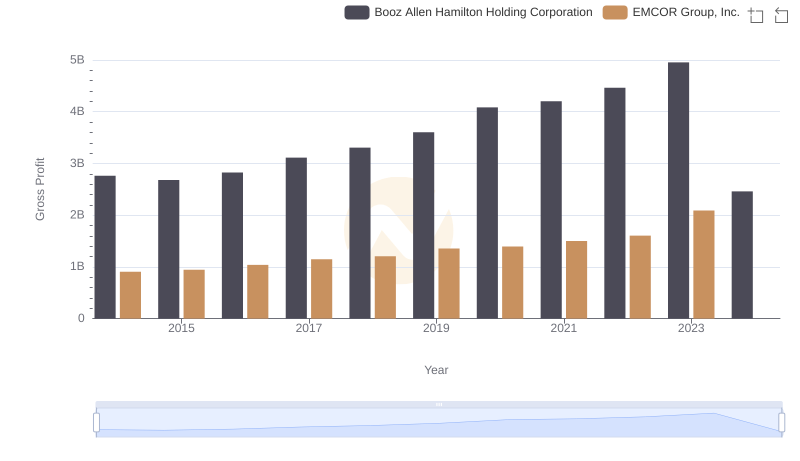
Gross Profit Trends Compared: EMCOR Group, Inc. vs Booz Allen Hamilton Holding Corporation
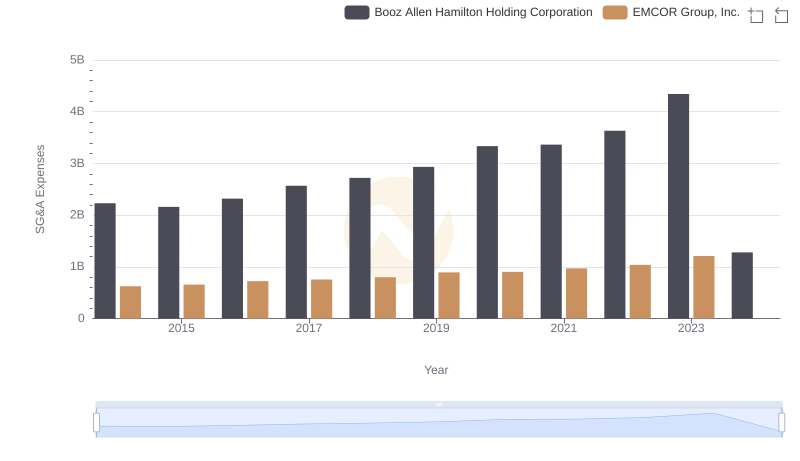
EMCOR Group, Inc. vs Booz Allen Hamilton Holding Corporation: SG&A Expense Trends
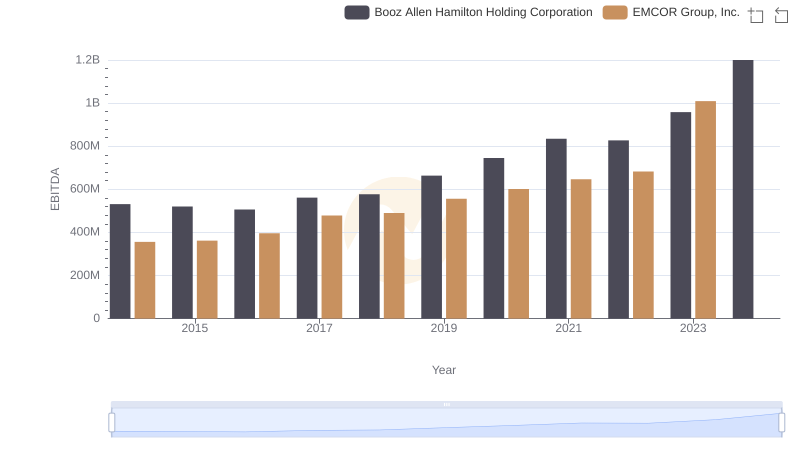
A Professional Review of EBITDA: EMCOR Group, Inc. Compared to Booz Allen Hamilton Holding Corporation