| __timestamp | Carlisle Companies Incorporated | EMCOR Group, Inc. |
|---|---|---|
| Wednesday, January 1, 2014 | 819500000 | 907246000 |
| Thursday, January 1, 2015 | 1006700000 | 944479000 |
| Friday, January 1, 2016 | 1157300000 | 1037862000 |
| Sunday, January 1, 2017 | 1148000000 | 1147012000 |
| Monday, January 1, 2018 | 1174700000 | 1205453000 |
| Tuesday, January 1, 2019 | 1371700000 | 1355868000 |
| Wednesday, January 1, 2020 | 1137400000 | 1395382000 |
| Friday, January 1, 2021 | 1314700000 | 1501737000 |
| Saturday, January 1, 2022 | 2157400000 | 1603594000 |
| Sunday, January 1, 2023 | 1544000000 | 2089339000 |
| Monday, January 1, 2024 | 1887700000 |
Unveiling the hidden dimensions of data
In the competitive landscape of industrial services and manufacturing, EMCOR Group, Inc. and Carlisle Companies Incorporated have shown remarkable growth in their gross profits over the past decade. From 2014 to 2023, both companies have demonstrated resilience and adaptability in a rapidly changing market.
EMCOR Group, Inc. has seen its gross profit grow by approximately 130% from 2014 to 2023, peaking in 2023 with a significant increase. Meanwhile, Carlisle Companies Incorporated experienced a staggering 160% growth in the same period, with a notable spike in 2022. This surge can be attributed to strategic acquisitions and a focus on innovation.
While both companies have shown impressive growth, Carlisle's 2022 performance stands out, marking a 57% increase from the previous year. EMCOR, on the other hand, maintained steady growth, culminating in a 30% rise in 2023. These trends highlight the dynamic nature of the industry and the importance of strategic planning.
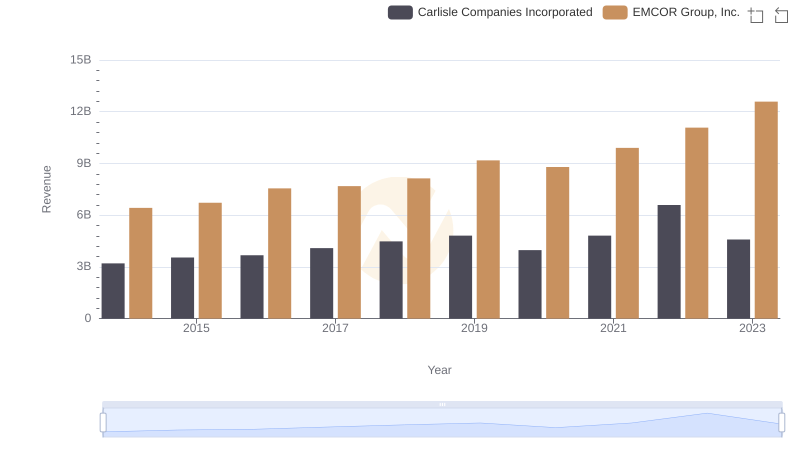
EMCOR Group, Inc. or Carlisle Companies Incorporated: Who Leads in Yearly Revenue?
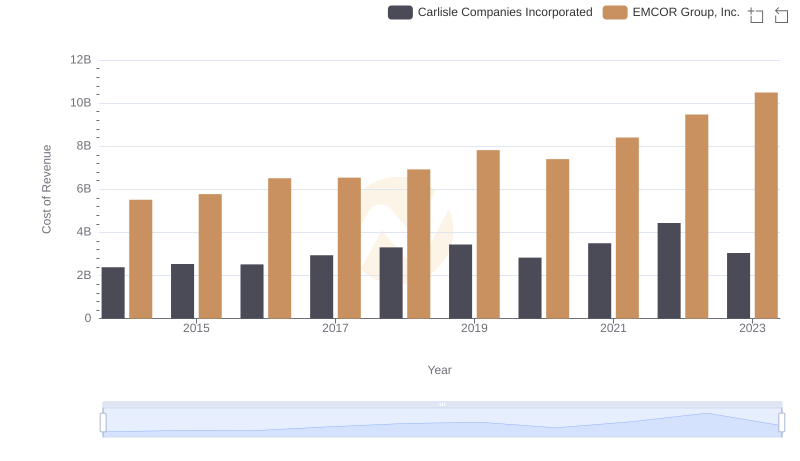
Comparing Cost of Revenue Efficiency: EMCOR Group, Inc. vs Carlisle Companies Incorporated
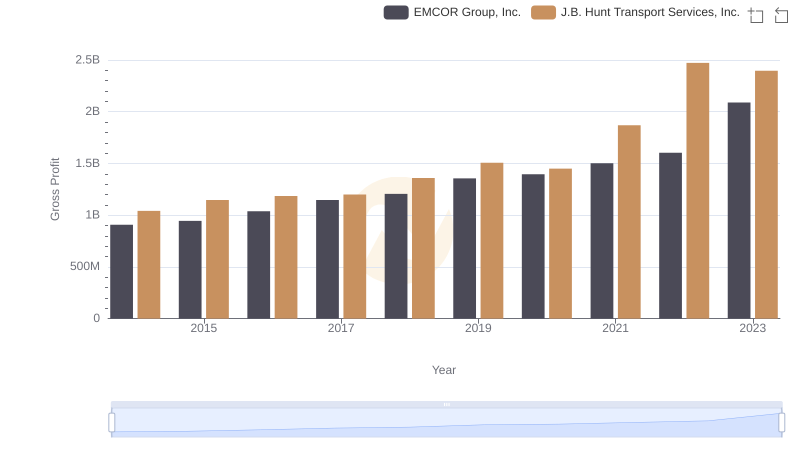
Gross Profit Trends Compared: EMCOR Group, Inc. vs J.B. Hunt Transport Services, Inc.
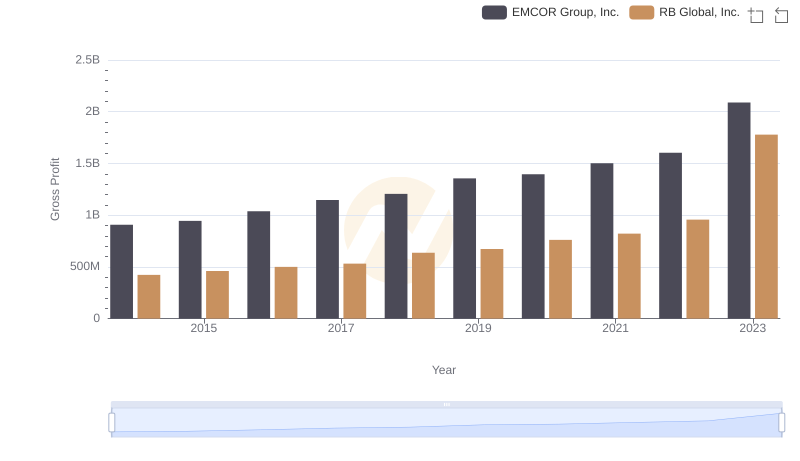
EMCOR Group, Inc. and RB Global, Inc.: A Detailed Gross Profit Analysis
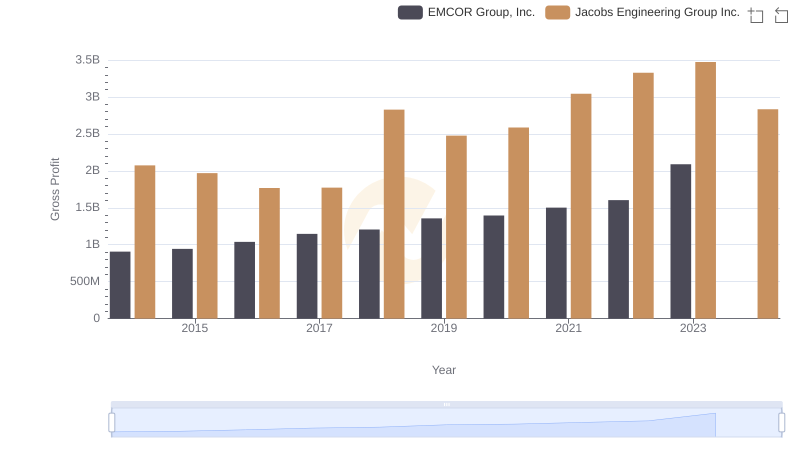
Who Generates Higher Gross Profit? EMCOR Group, Inc. or Jacobs Engineering Group Inc.
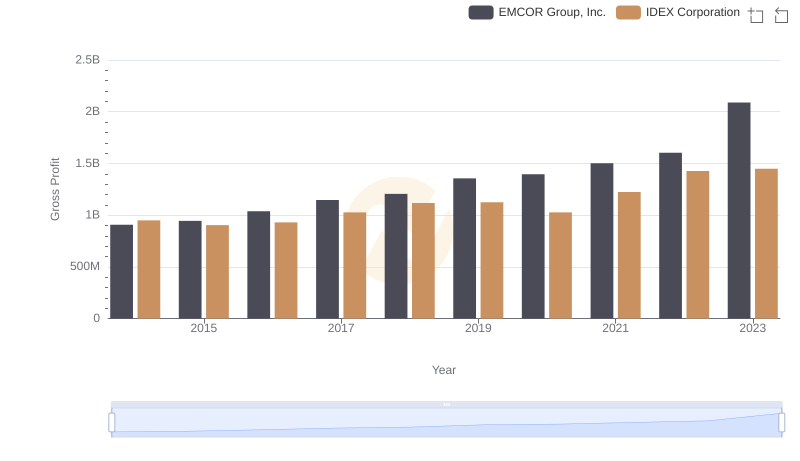
EMCOR Group, Inc. vs IDEX Corporation: A Gross Profit Performance Breakdown
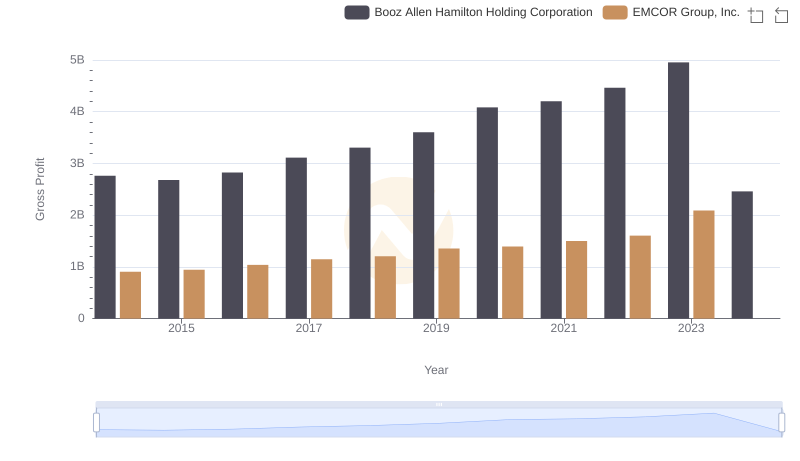
Gross Profit Trends Compared: EMCOR Group, Inc. vs Booz Allen Hamilton Holding Corporation
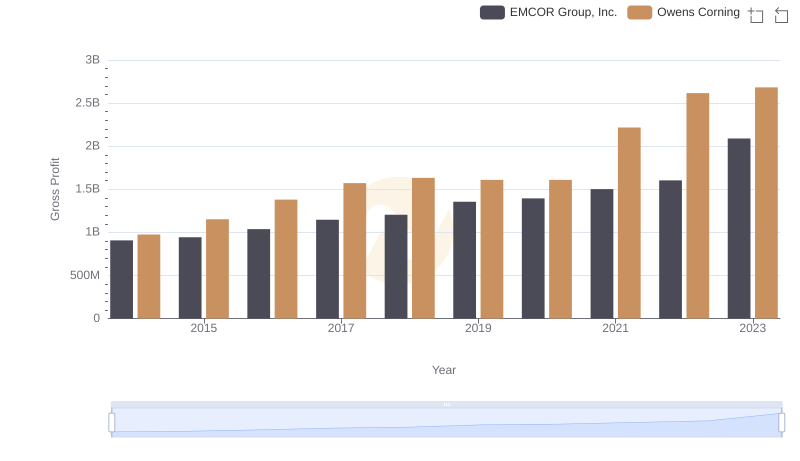
Gross Profit Trends Compared: EMCOR Group, Inc. vs Owens Corning
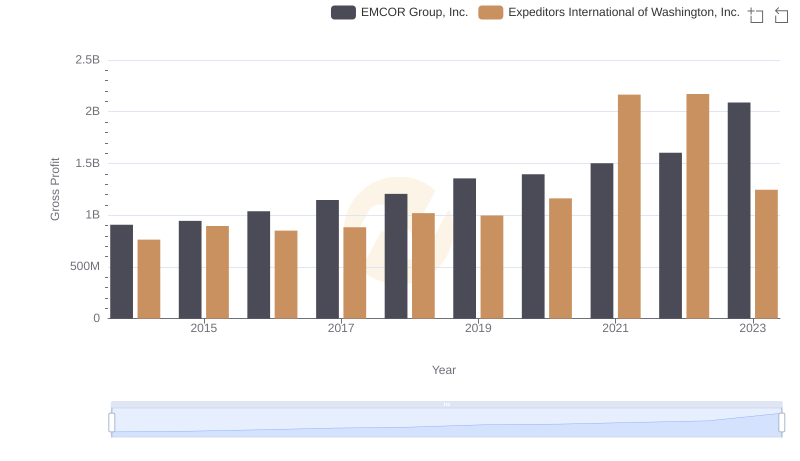
Gross Profit Analysis: Comparing EMCOR Group, Inc. and Expeditors International of Washington, Inc.
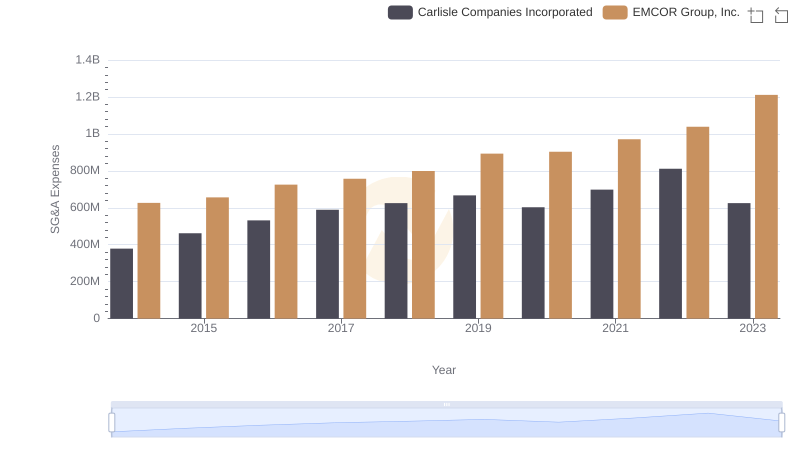
Breaking Down SG&A Expenses: EMCOR Group, Inc. vs Carlisle Companies Incorporated
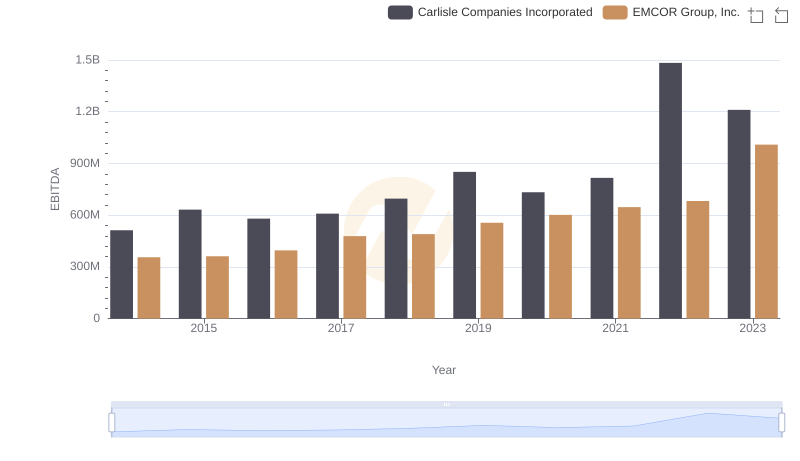
EMCOR Group, Inc. and Carlisle Companies Incorporated: A Detailed Examination of EBITDA Performance