| __timestamp | Booz Allen Hamilton Holding Corporation | EMCOR Group, Inc. |
|---|---|---|
| Wednesday, January 1, 2014 | 531144000 | 355858000 |
| Thursday, January 1, 2015 | 520410000 | 362095000 |
| Friday, January 1, 2016 | 506120000 | 395913000 |
| Sunday, January 1, 2017 | 561524000 | 478459000 |
| Monday, January 1, 2018 | 577061000 | 489954000 |
| Tuesday, January 1, 2019 | 663731000 | 556055000 |
| Wednesday, January 1, 2020 | 745424000 | 601449000 |
| Friday, January 1, 2021 | 834449000 | 646861000 |
| Saturday, January 1, 2022 | 826865000 | 682399000 |
| Sunday, January 1, 2023 | 958150000 | 1009017000 |
| Monday, January 1, 2024 | 1199992000 |
Unleashing insights
In the competitive landscape of the U.S. stock market, EMCOR Group, Inc. and Booz Allen Hamilton Holding Corporation have demonstrated remarkable EBITDA growth over the past decade. From 2014 to 2023, Booz Allen Hamilton's EBITDA surged by approximately 80%, peaking at an impressive $1.2 billion in 2024. Meanwhile, EMCOR Group, Inc. showcased a robust growth trajectory, with its EBITDA increasing by nearly 184% over the same period, reaching a high of $1 billion in 2023.
This financial performance highlights the resilience and strategic prowess of both companies. Booz Allen Hamilton's consistent growth reflects its stronghold in the consulting sector, while EMCOR's significant leap underscores its expanding influence in the construction and facilities services industry. As we look to the future, these trends suggest a promising outlook for both corporations, despite the occasional data gaps in recent years.
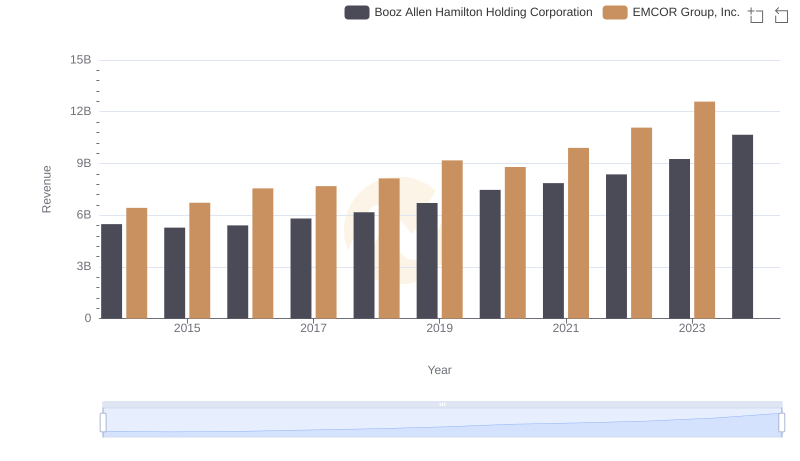
Revenue Insights: EMCOR Group, Inc. and Booz Allen Hamilton Holding Corporation Performance Compared
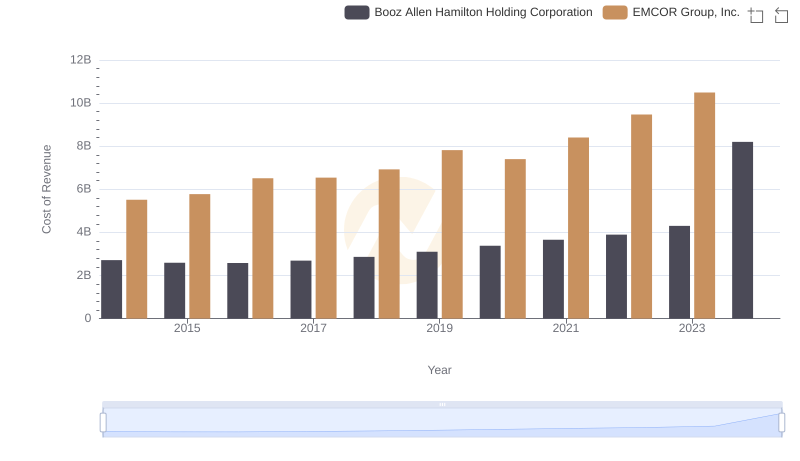
Cost of Revenue Trends: EMCOR Group, Inc. vs Booz Allen Hamilton Holding Corporation
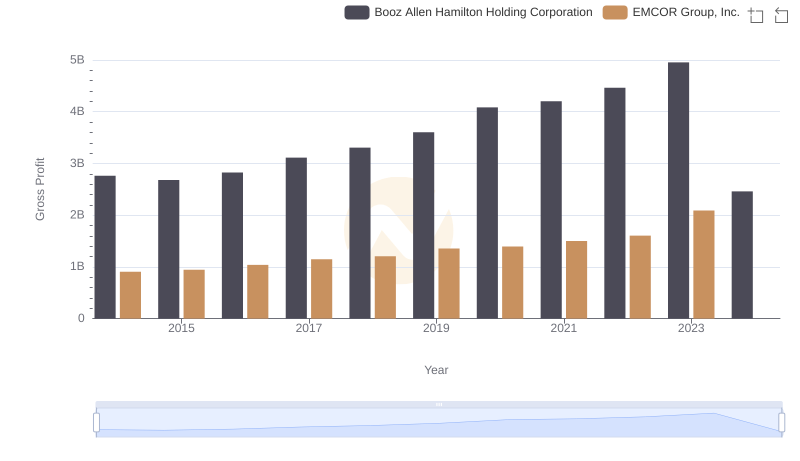
Gross Profit Trends Compared: EMCOR Group, Inc. vs Booz Allen Hamilton Holding Corporation
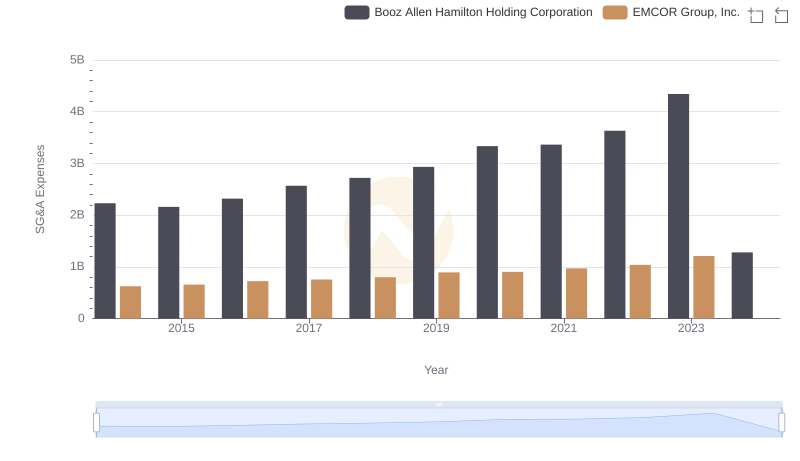
EMCOR Group, Inc. vs Booz Allen Hamilton Holding Corporation: SG&A Expense Trends
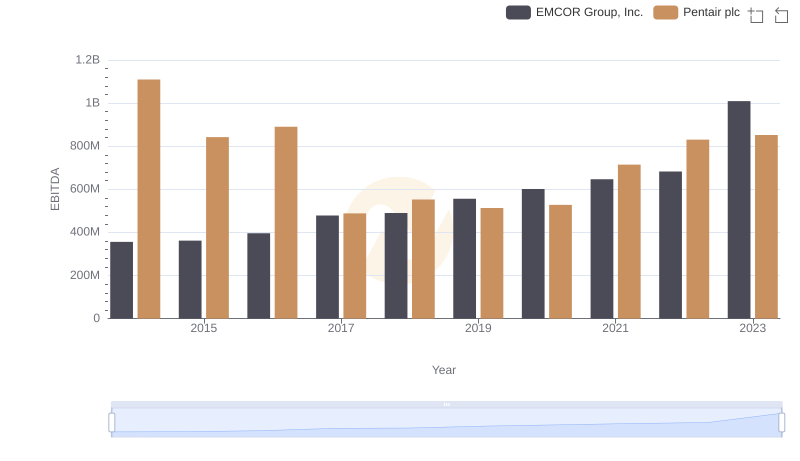
EBITDA Analysis: Evaluating EMCOR Group, Inc. Against Pentair plc
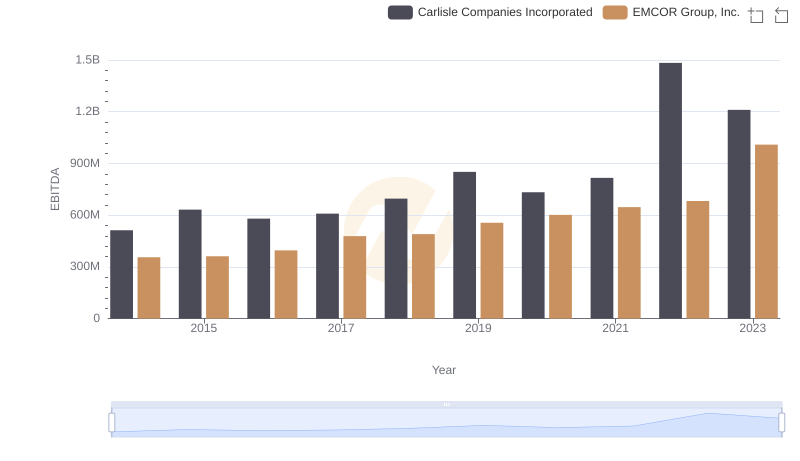
EMCOR Group, Inc. and Carlisle Companies Incorporated: A Detailed Examination of EBITDA Performance
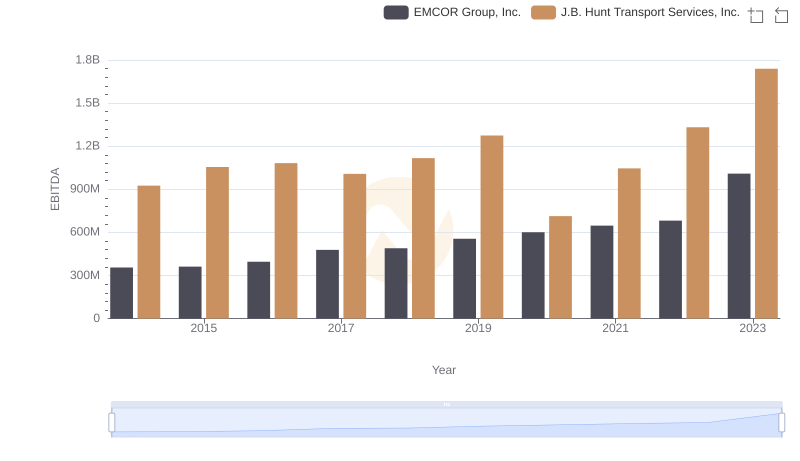
Comparative EBITDA Analysis: EMCOR Group, Inc. vs J.B. Hunt Transport Services, Inc.
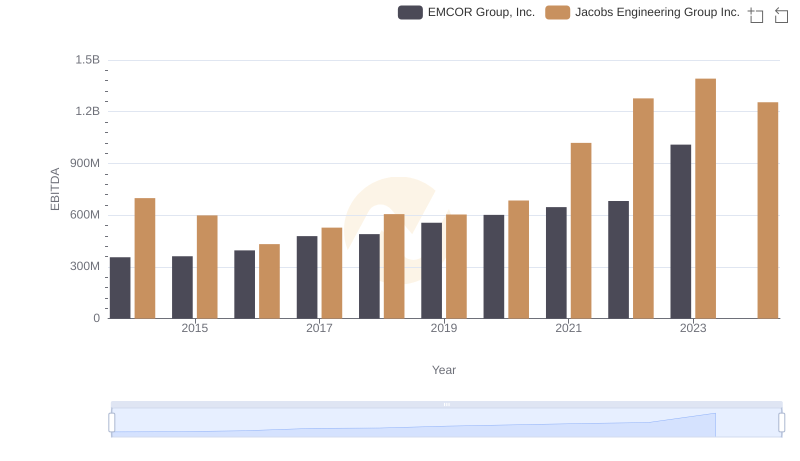
Comparative EBITDA Analysis: EMCOR Group, Inc. vs Jacobs Engineering Group Inc.
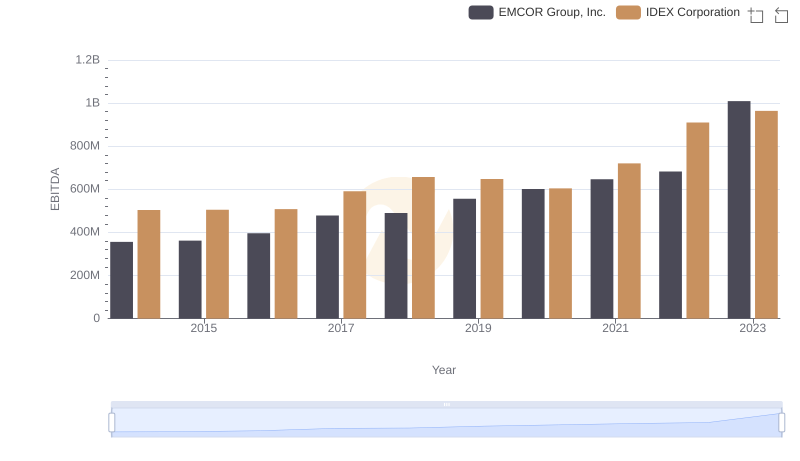
EBITDA Performance Review: EMCOR Group, Inc. vs IDEX Corporation
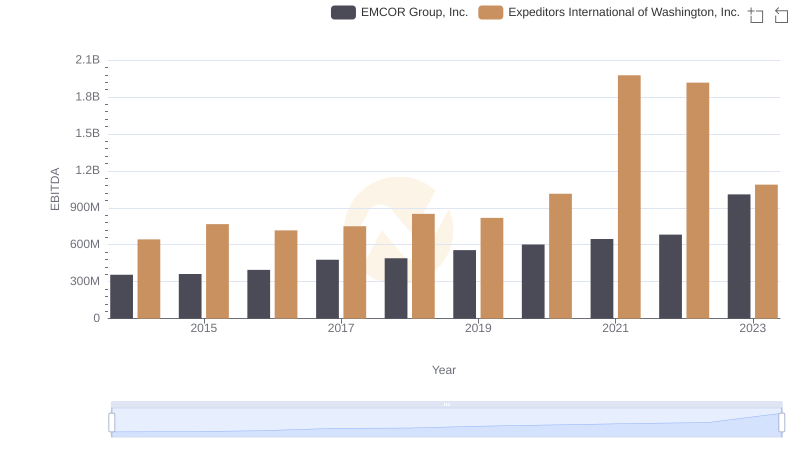
EBITDA Analysis: Evaluating EMCOR Group, Inc. Against Expeditors International of Washington, Inc.