| __timestamp | EMCOR Group, Inc. | Expeditors International of Washington, Inc. |
|---|---|---|
| Wednesday, January 1, 2014 | 907246000 | 763996000 |
| Thursday, January 1, 2015 | 944479000 | 895784000 |
| Friday, January 1, 2016 | 1037862000 | 850793000 |
| Sunday, January 1, 2017 | 1147012000 | 883027000 |
| Monday, January 1, 2018 | 1205453000 | 1020282000 |
| Tuesday, January 1, 2019 | 1355868000 | 997021000 |
| Wednesday, January 1, 2020 | 1395382000 | 1162765000 |
| Friday, January 1, 2021 | 1501737000 | 2165412000 |
| Saturday, January 1, 2022 | 1603594000 | 2171130000 |
| Sunday, January 1, 2023 | 2089339000 | 1245476000 |
| Monday, January 1, 2024 | 10600515000 |
Unleashing the power of data
In the ever-evolving landscape of the U.S. stock market, understanding the financial health of companies is crucial. This analysis delves into the gross profit trends of two industry giants: EMCOR Group, Inc. and Expeditors International of Washington, Inc., from 2014 to 2023.
EMCOR Group, Inc. has shown a consistent upward trajectory in gross profit, with a remarkable 130% increase over the decade, peaking at $2.1 billion in 2023. In contrast, Expeditors International experienced a significant surge in 2021, with a 110% increase from 2020, reaching its highest gross profit of $2.17 billion. However, by 2023, their profits declined by 43% to $1.25 billion.
These trends highlight EMCOR's steady growth and Expeditors' volatility, offering valuable insights for investors and market analysts.
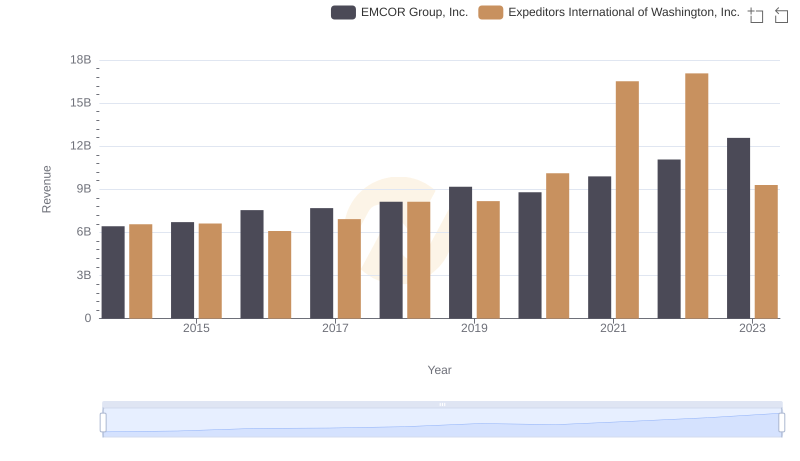
EMCOR Group, Inc. or Expeditors International of Washington, Inc.: Who Leads in Yearly Revenue?
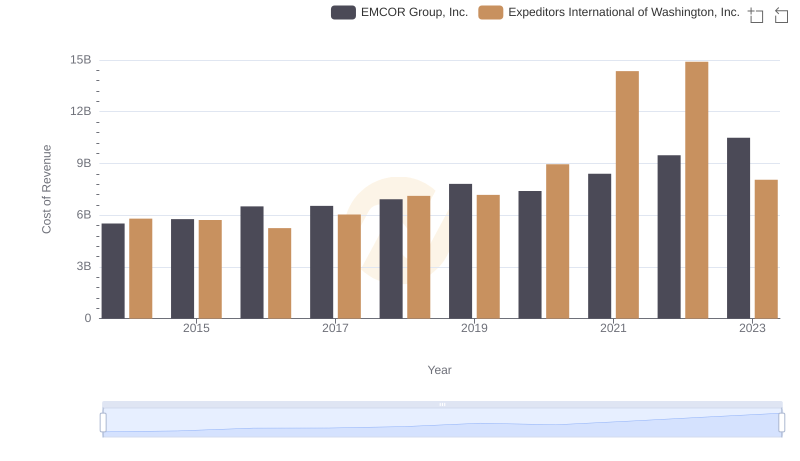
Cost of Revenue: Key Insights for EMCOR Group, Inc. and Expeditors International of Washington, Inc.
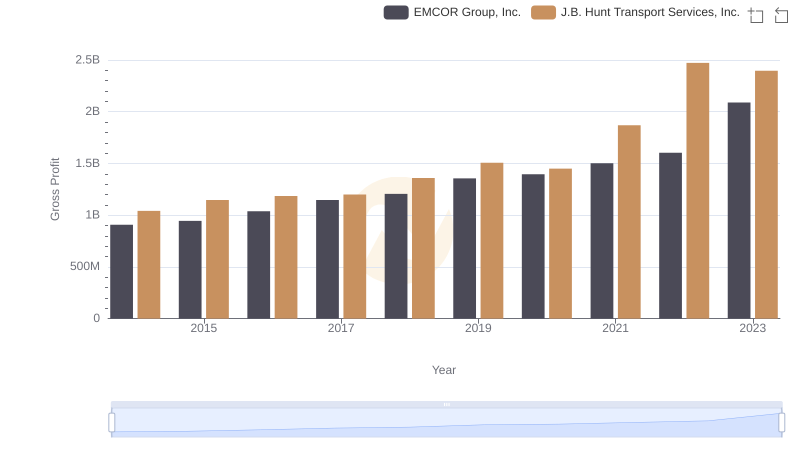
Gross Profit Trends Compared: EMCOR Group, Inc. vs J.B. Hunt Transport Services, Inc.
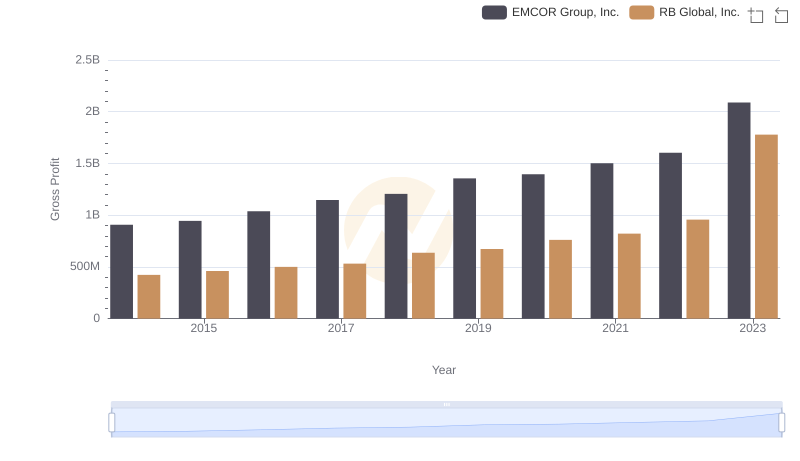
EMCOR Group, Inc. and RB Global, Inc.: A Detailed Gross Profit Analysis
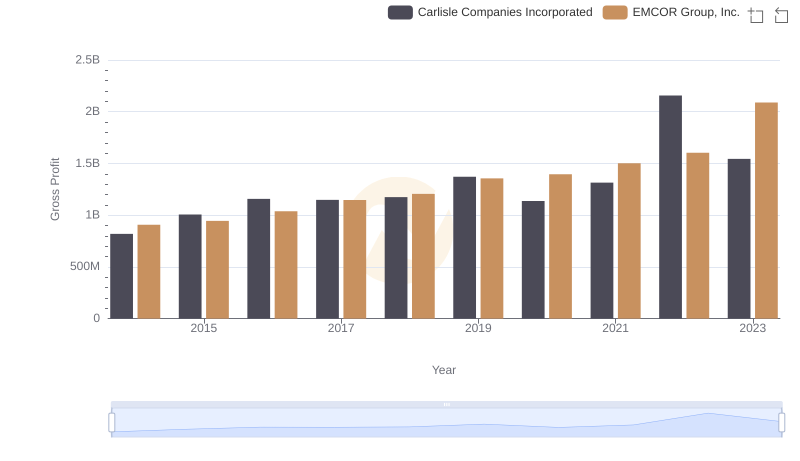
Gross Profit Trends Compared: EMCOR Group, Inc. vs Carlisle Companies Incorporated
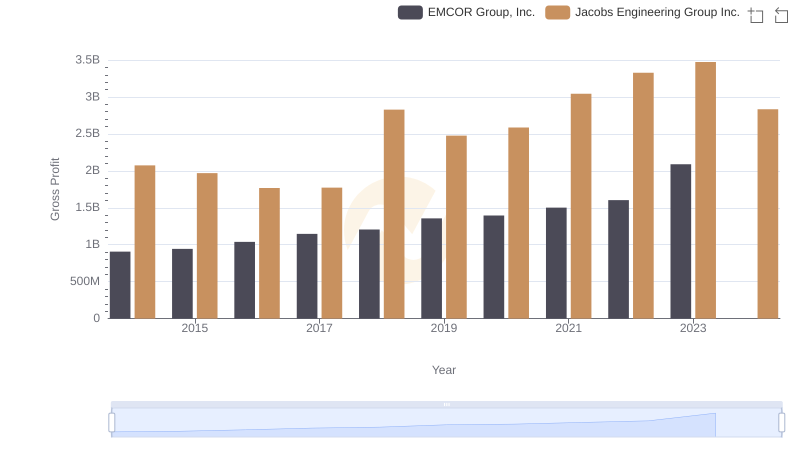
Who Generates Higher Gross Profit? EMCOR Group, Inc. or Jacobs Engineering Group Inc.
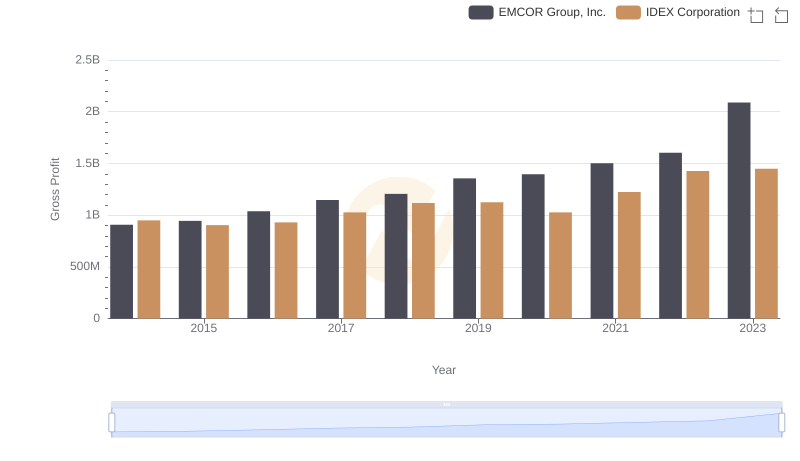
EMCOR Group, Inc. vs IDEX Corporation: A Gross Profit Performance Breakdown
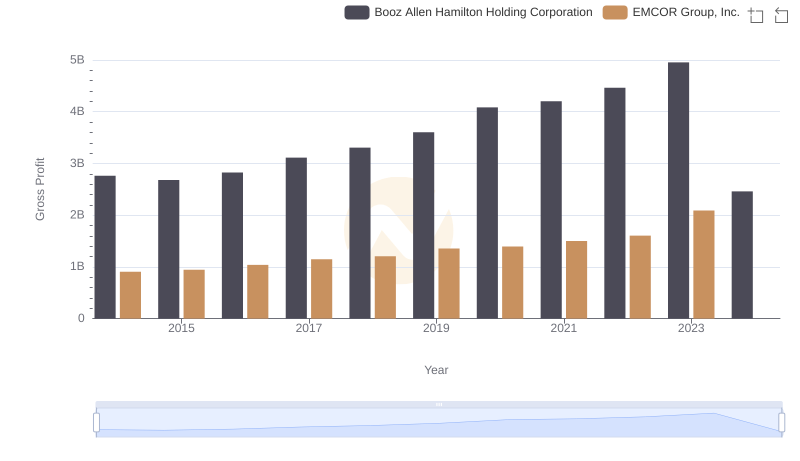
Gross Profit Trends Compared: EMCOR Group, Inc. vs Booz Allen Hamilton Holding Corporation
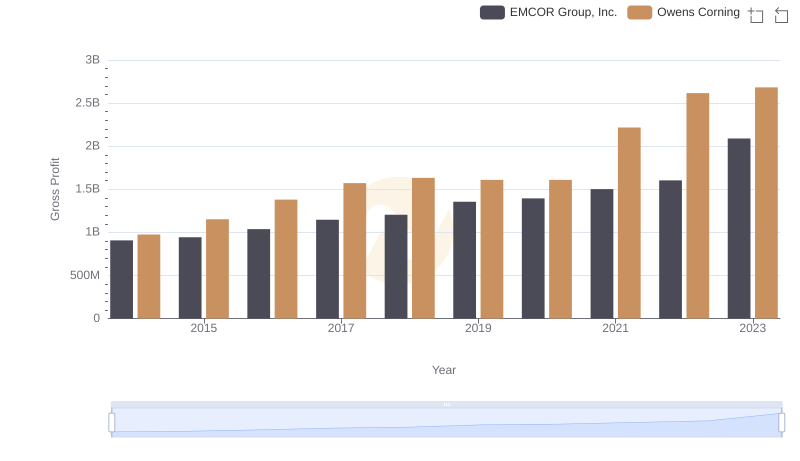
Gross Profit Trends Compared: EMCOR Group, Inc. vs Owens Corning
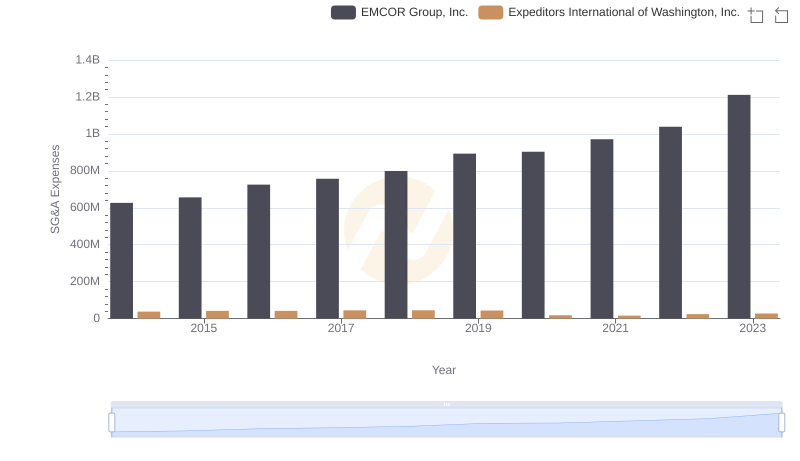
EMCOR Group, Inc. and Expeditors International of Washington, Inc.: SG&A Spending Patterns Compared
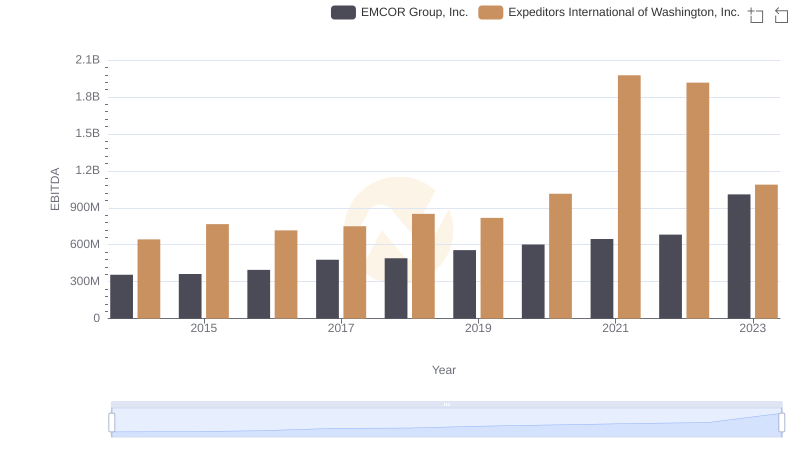
EBITDA Analysis: Evaluating EMCOR Group, Inc. Against Expeditors International of Washington, Inc.