| __timestamp | EMCOR Group, Inc. | Owens Corning |
|---|---|---|
| Wednesday, January 1, 2014 | 907246000 | 976000000 |
| Thursday, January 1, 2015 | 944479000 | 1153000000 |
| Friday, January 1, 2016 | 1037862000 | 1381000000 |
| Sunday, January 1, 2017 | 1147012000 | 1572000000 |
| Monday, January 1, 2018 | 1205453000 | 1632000000 |
| Tuesday, January 1, 2019 | 1355868000 | 1609000000 |
| Wednesday, January 1, 2020 | 1395382000 | 1610000000 |
| Friday, January 1, 2021 | 1501737000 | 2217000000 |
| Saturday, January 1, 2022 | 1603594000 | 2616000000 |
| Sunday, January 1, 2023 | 2089339000 | 2683000000 |
Unleashing the power of data
In the competitive landscape of the construction and manufacturing sectors, EMCOR Group, Inc. and Owens Corning have shown remarkable growth in their gross profits over the past decade. From 2014 to 2023, EMCOR Group, Inc. has seen its gross profit more than double, with a notable increase of approximately 130%. Meanwhile, Owens Corning has experienced a similar upward trajectory, with its gross profit growing by around 175% during the same period.
Starting in 2014, both companies had gross profits under $1 billion. By 2023, EMCOR Group, Inc. reached over $2 billion, while Owens Corning surpassed $2.6 billion. This growth reflects their strategic expansions and market adaptability. The year 2021 marked a significant leap for Owens Corning, with a 38% increase from the previous year, highlighting its resilience and market demand.
These trends underscore the dynamic nature of the industry and the companies' ability to capitalize on market opportunities.
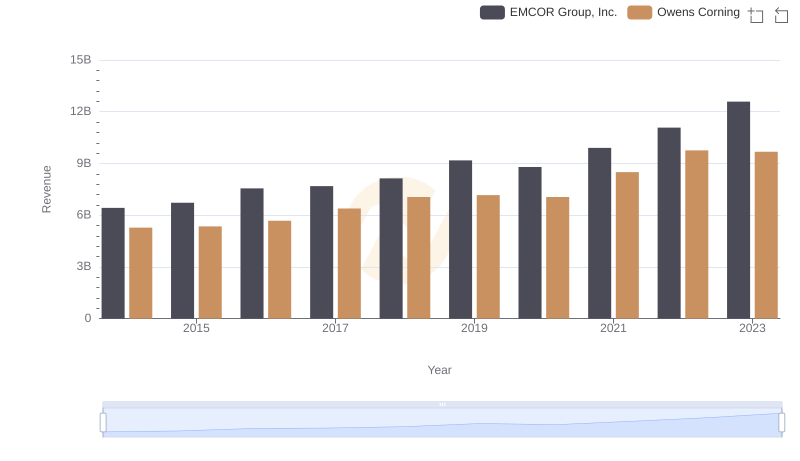
EMCOR Group, Inc. vs Owens Corning: Examining Key Revenue Metrics
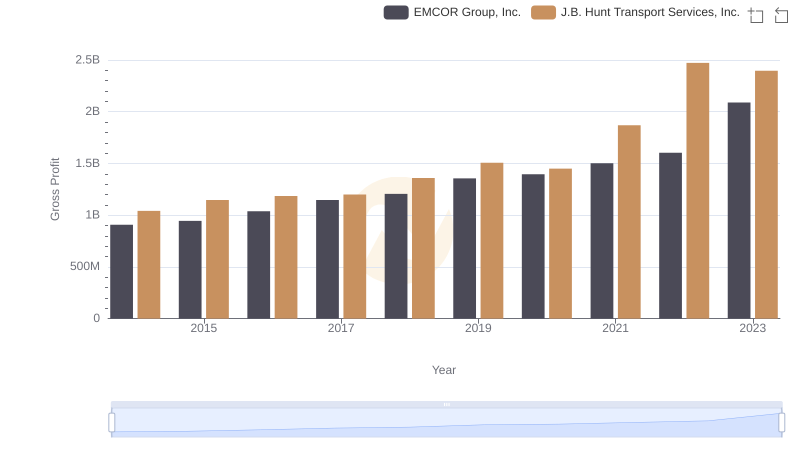
Gross Profit Trends Compared: EMCOR Group, Inc. vs J.B. Hunt Transport Services, Inc.
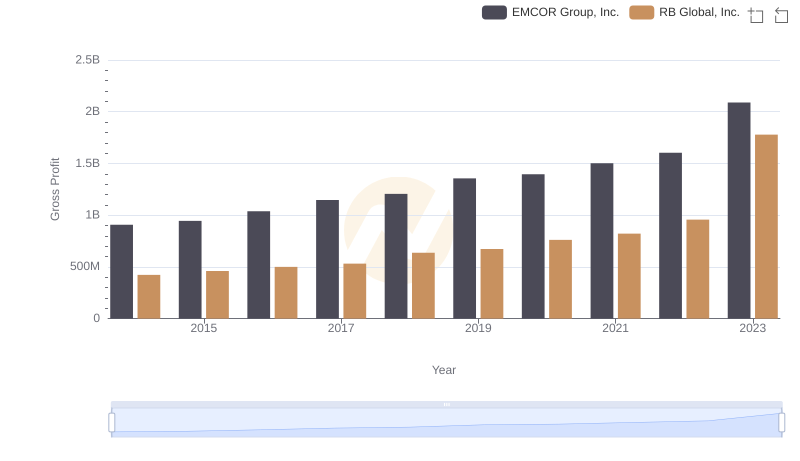
EMCOR Group, Inc. and RB Global, Inc.: A Detailed Gross Profit Analysis
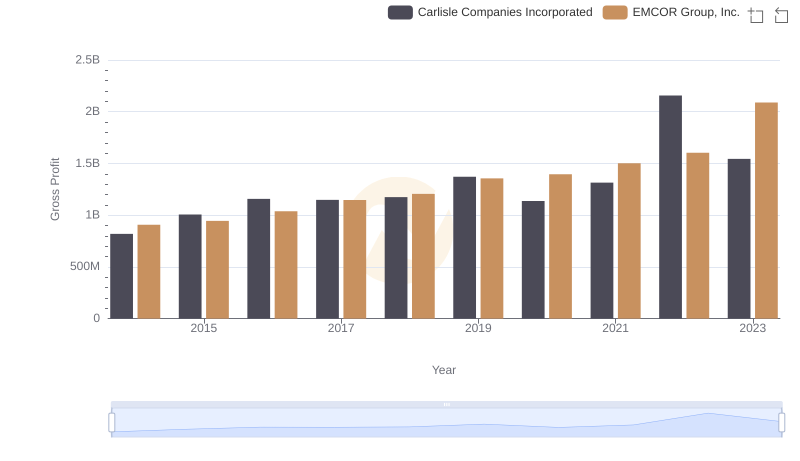
Gross Profit Trends Compared: EMCOR Group, Inc. vs Carlisle Companies Incorporated
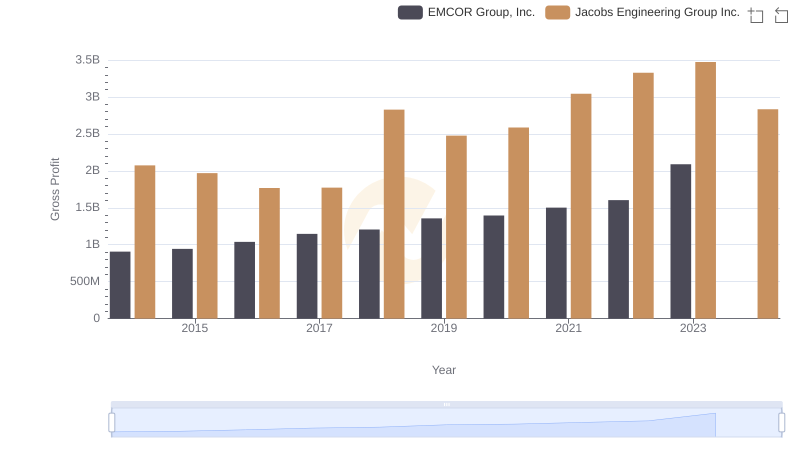
Who Generates Higher Gross Profit? EMCOR Group, Inc. or Jacobs Engineering Group Inc.
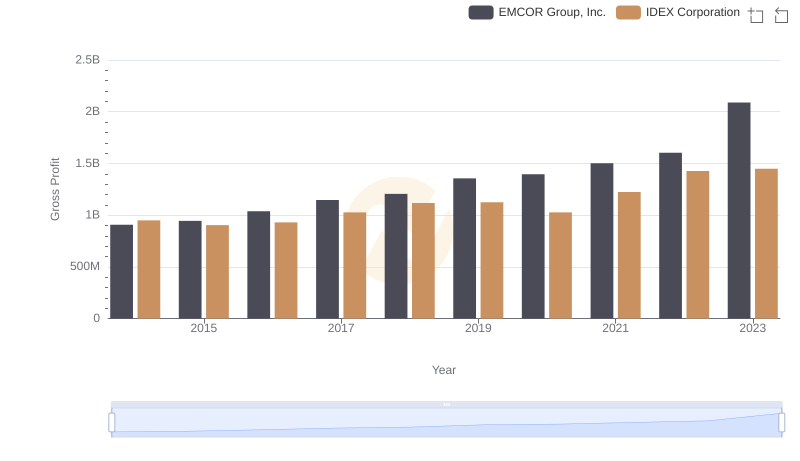
EMCOR Group, Inc. vs IDEX Corporation: A Gross Profit Performance Breakdown
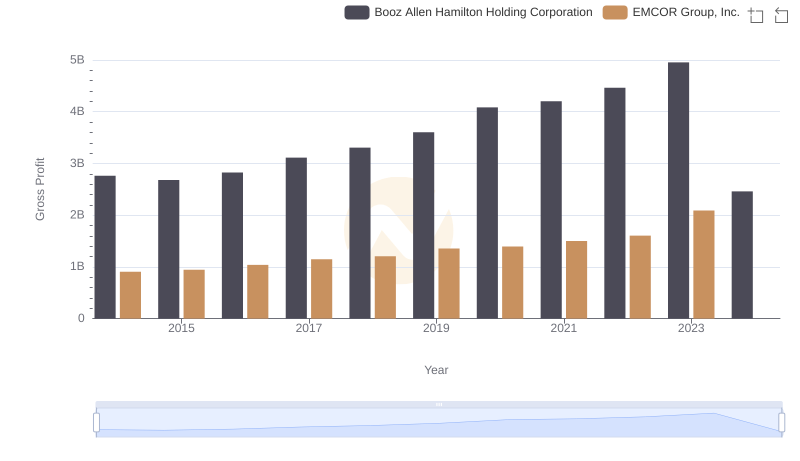
Gross Profit Trends Compared: EMCOR Group, Inc. vs Booz Allen Hamilton Holding Corporation
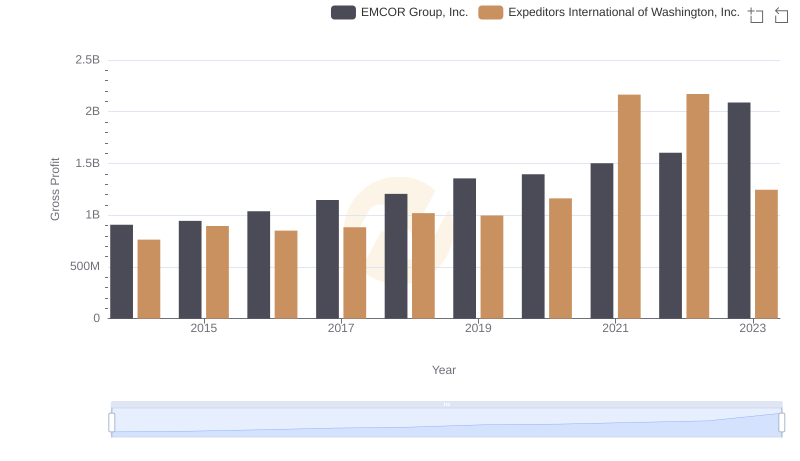
Gross Profit Analysis: Comparing EMCOR Group, Inc. and Expeditors International of Washington, Inc.