| __timestamp | Booz Allen Hamilton Holding Corporation | EMCOR Group, Inc. |
|---|---|---|
| Wednesday, January 1, 2014 | 2716113000 | 5517719000 |
| Thursday, January 1, 2015 | 2593849000 | 5774247000 |
| Friday, January 1, 2016 | 2580026000 | 6513662000 |
| Sunday, January 1, 2017 | 2691982000 | 6539987000 |
| Monday, January 1, 2018 | 2867103000 | 6925178000 |
| Tuesday, January 1, 2019 | 3100466000 | 7818743000 |
| Wednesday, January 1, 2020 | 3379180000 | 7401679000 |
| Friday, January 1, 2021 | 3657530000 | 8401843000 |
| Saturday, January 1, 2022 | 3899622000 | 9472526000 |
| Sunday, January 1, 2023 | 4304810000 | 10493534000 |
| Monday, January 1, 2024 | 8202847000 |
Infusing magic into the data realm
In the ever-evolving landscape of corporate America, understanding cost dynamics is crucial. This chart delves into the cost of revenue trends for two industry titans: EMCOR Group, Inc. and Booz Allen Hamilton Holding Corporation, from 2014 to 2023. Over this decade, EMCOR consistently outpaced Booz Allen in cost of revenue, reflecting its expansive operations in the construction and facilities services sector. Notably, EMCOR's cost of revenue surged by approximately 90% from 2014 to 2023, peaking at over $10 billion in 2023. In contrast, Booz Allen, a leader in management and IT consulting, saw a more modest increase of around 60%, reaching over $4 billion in 2023. The data for 2024 shows a significant spike for Booz Allen, but EMCOR's data is missing, leaving room for speculation. These trends highlight the differing growth trajectories and operational scales of these two corporate powerhouses.
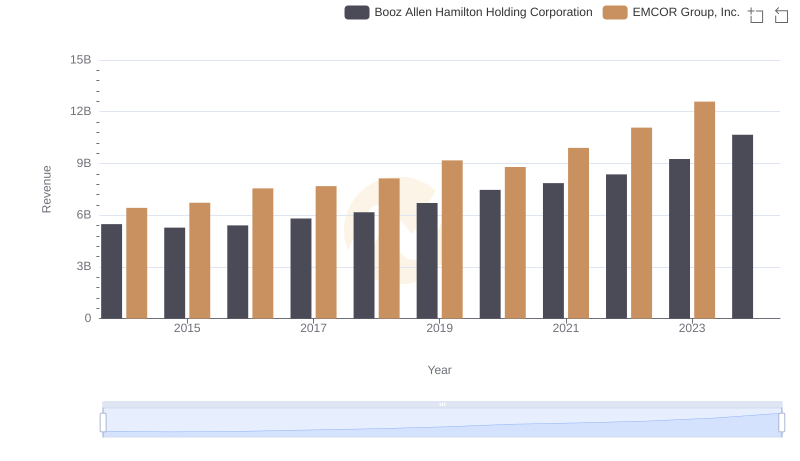
Revenue Insights: EMCOR Group, Inc. and Booz Allen Hamilton Holding Corporation Performance Compared
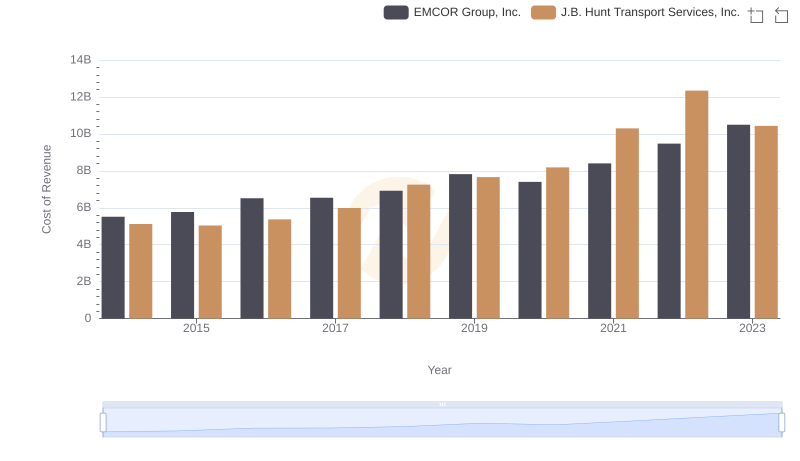
Cost of Revenue: Key Insights for EMCOR Group, Inc. and J.B. Hunt Transport Services, Inc.
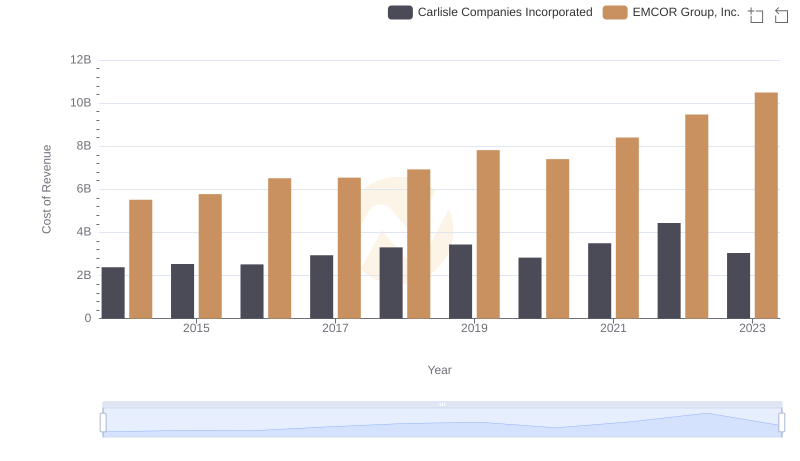
Comparing Cost of Revenue Efficiency: EMCOR Group, Inc. vs Carlisle Companies Incorporated
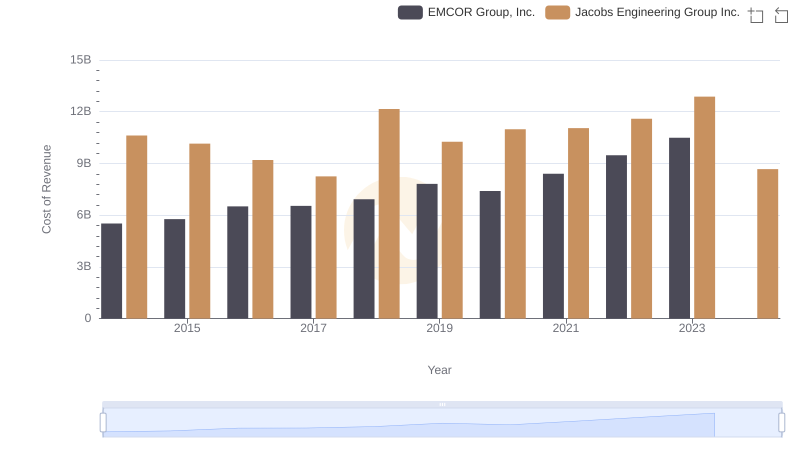
EMCOR Group, Inc. vs Jacobs Engineering Group Inc.: Efficiency in Cost of Revenue Explored
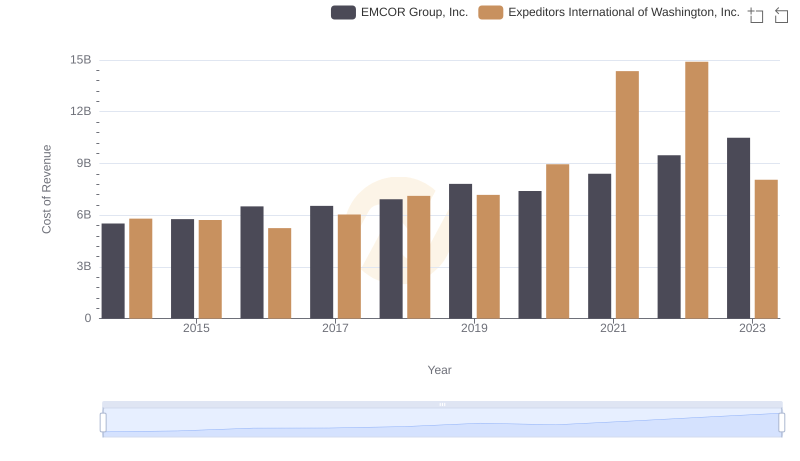
Cost of Revenue: Key Insights for EMCOR Group, Inc. and Expeditors International of Washington, Inc.
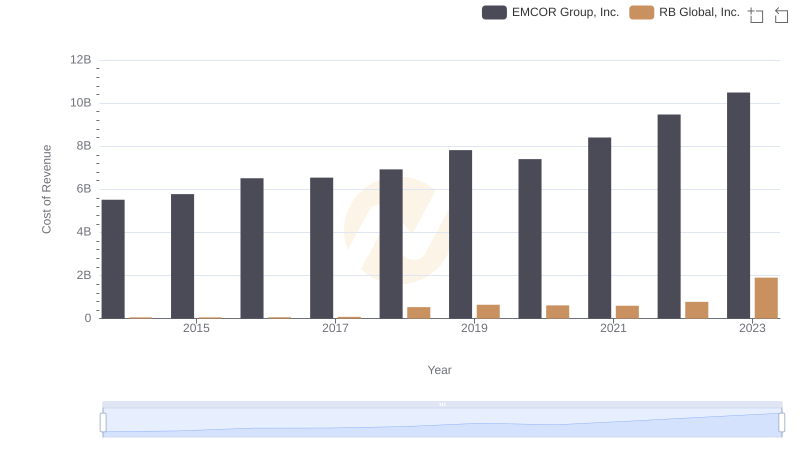
EMCOR Group, Inc. vs RB Global, Inc.: Efficiency in Cost of Revenue Explored
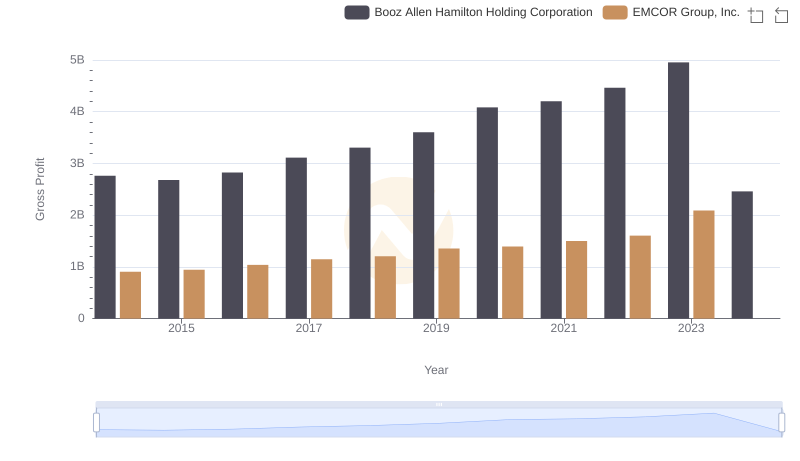
Gross Profit Trends Compared: EMCOR Group, Inc. vs Booz Allen Hamilton Holding Corporation
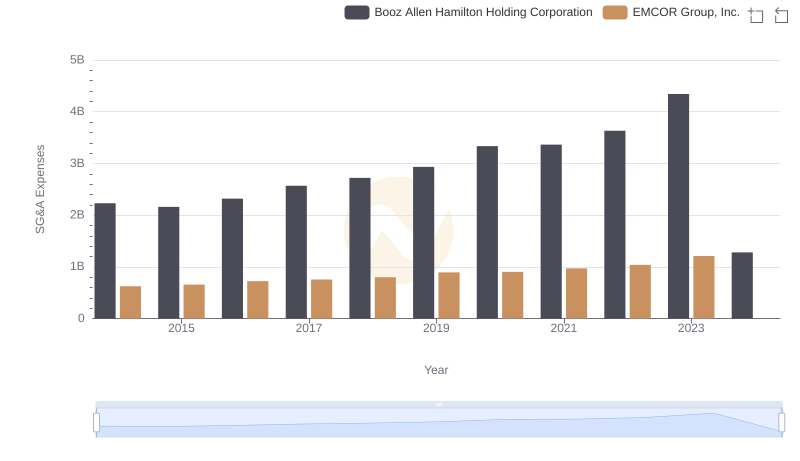
EMCOR Group, Inc. vs Booz Allen Hamilton Holding Corporation: SG&A Expense Trends
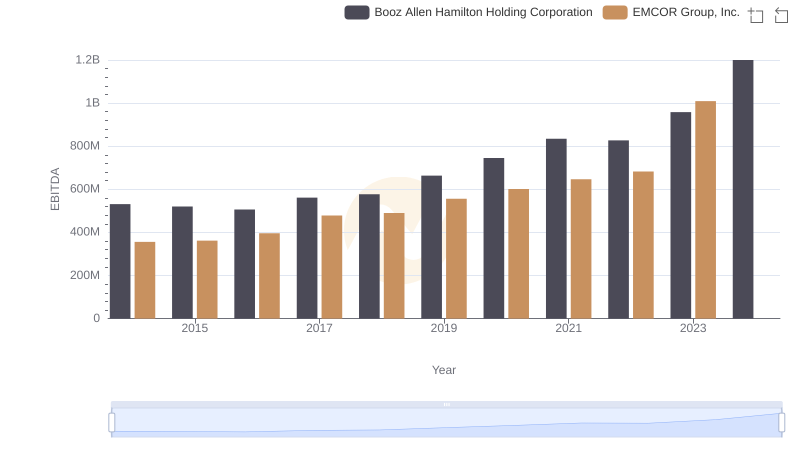
A Professional Review of EBITDA: EMCOR Group, Inc. Compared to Booz Allen Hamilton Holding Corporation