| __timestamp | Cintas Corporation | Hubbell Incorporated |
|---|---|---|
| Wednesday, January 1, 2014 | 1914386000 | 1109000000 |
| Thursday, January 1, 2015 | 1921337000 | 1091800000 |
| Friday, January 1, 2016 | 2129870000 | 1100700000 |
| Sunday, January 1, 2017 | 2380295000 | 1151900000 |
| Monday, January 1, 2018 | 2908523000 | 1300400000 |
| Tuesday, January 1, 2019 | 3128588000 | 1352700000 |
| Wednesday, January 1, 2020 | 3233748000 | 1209300000 |
| Friday, January 1, 2021 | 3314651000 | 1151500000 |
| Saturday, January 1, 2022 | 3632246000 | 1471600000 |
| Sunday, January 1, 2023 | 4173368000 | 1888100000 |
| Monday, January 1, 2024 | 4686416000 | 1904100000 |
Igniting the spark of knowledge
In the ever-evolving landscape of American industry, Cintas Corporation and Hubbell Incorporated stand as titans in their respective fields. Over the past decade, Cintas has demonstrated a remarkable growth trajectory, with its gross profit surging by approximately 145% from 2014 to 2023. This impressive rise underscores Cintas's strategic prowess in the uniform and facility services sector.
Conversely, Hubbell Incorporated, a leader in electrical and electronic products, has experienced a more modest growth of around 70% over the same period. Despite this, Hubbell's gross profit reached a peak in 2023, showcasing its resilience and adaptability in a competitive market.
While Cintas's data for 2024 is available, Hubbell's is notably absent, leaving room for speculation about its future performance. As these two giants continue to navigate the complexities of their industries, their financial trajectories offer valuable insights into their strategic directions.
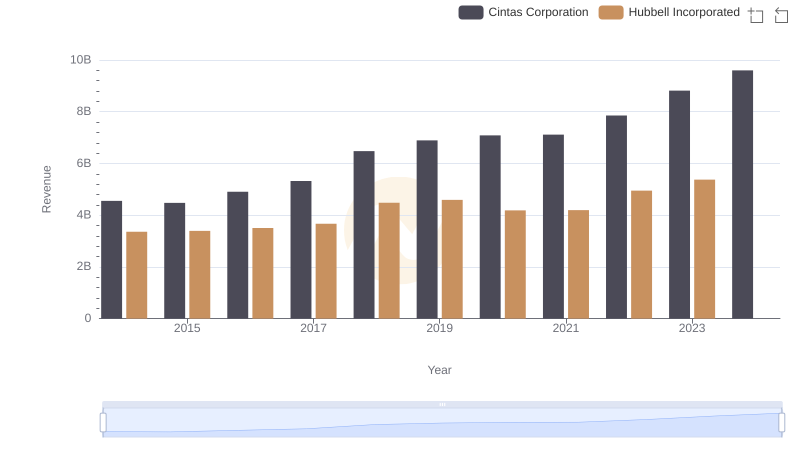
Comparing Revenue Performance: Cintas Corporation or Hubbell Incorporated?
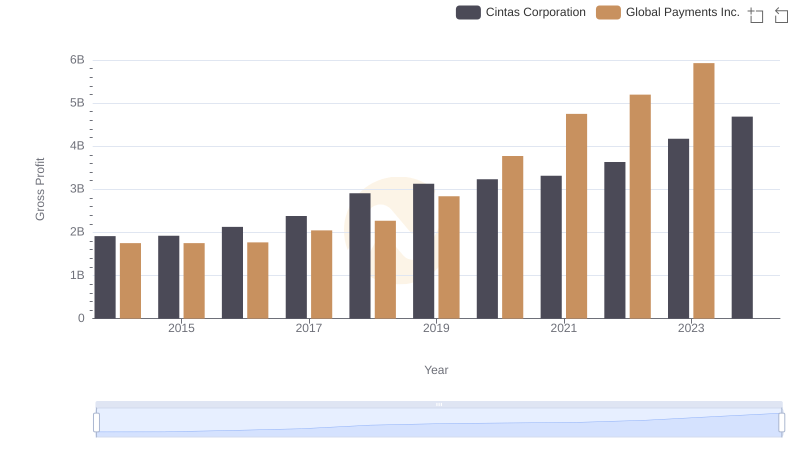
Who Generates Higher Gross Profit? Cintas Corporation or Global Payments Inc.
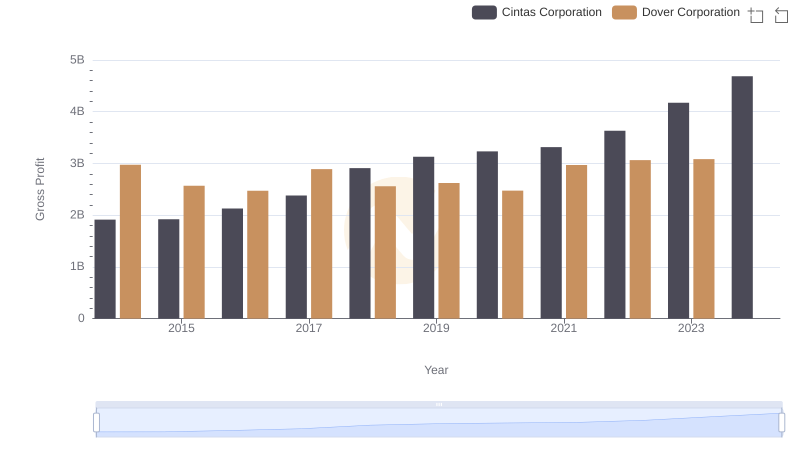
Gross Profit Analysis: Comparing Cintas Corporation and Dover Corporation
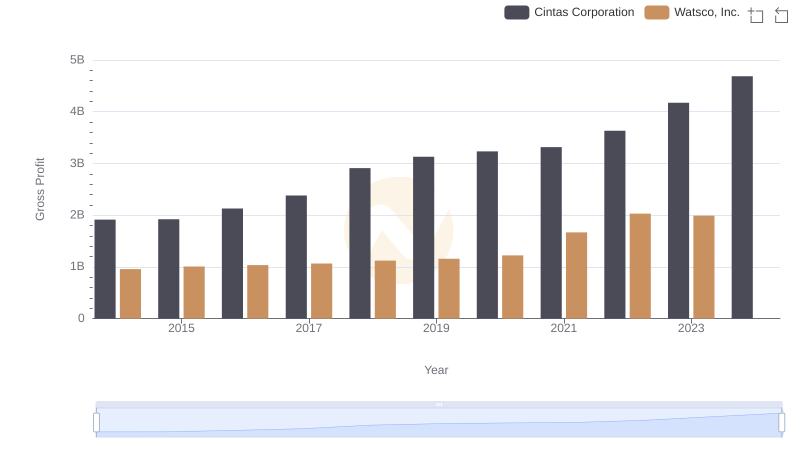
Cintas Corporation and Watsco, Inc.: A Detailed Gross Profit Analysis
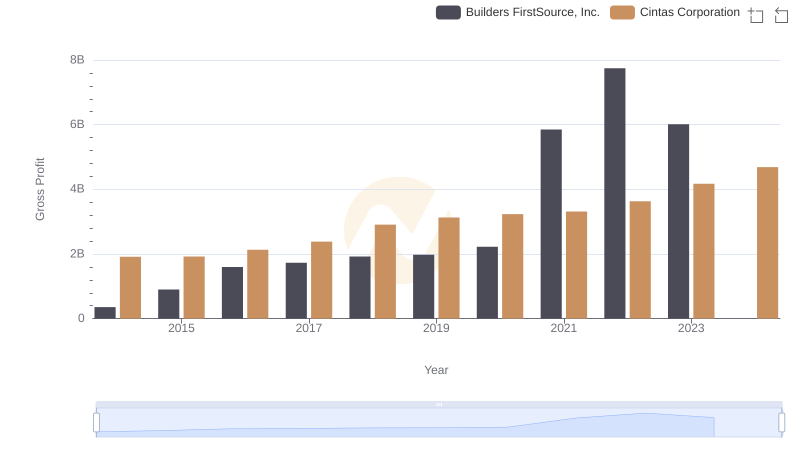
Key Insights on Gross Profit: Cintas Corporation vs Builders FirstSource, Inc.
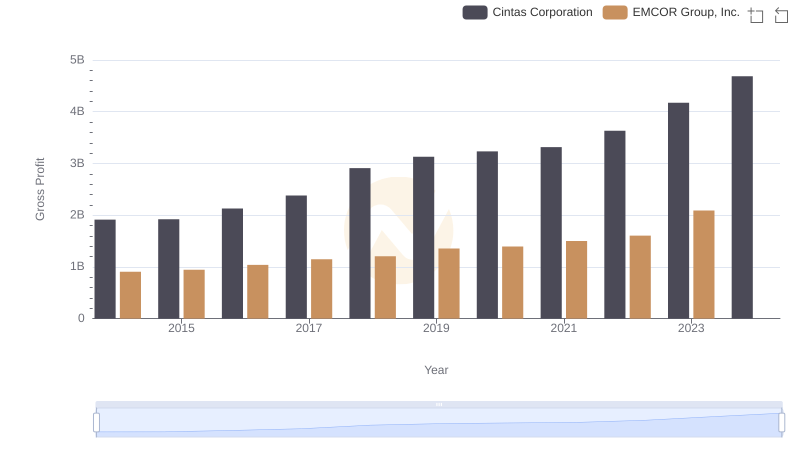
Gross Profit Trends Compared: Cintas Corporation vs EMCOR Group, Inc.
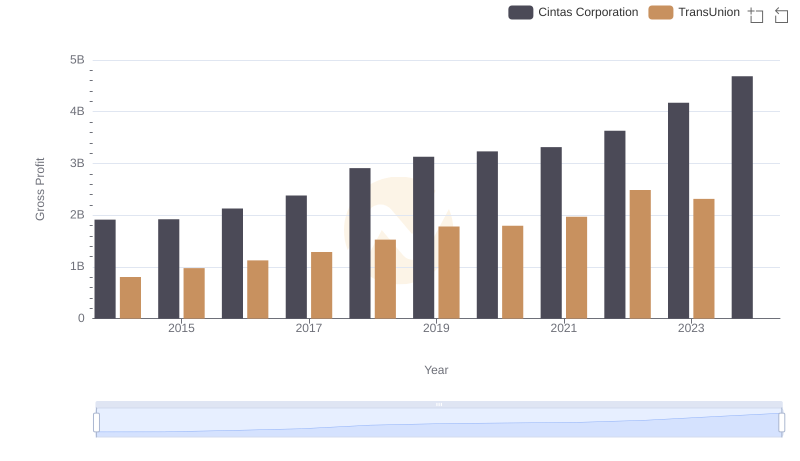
Gross Profit Trends Compared: Cintas Corporation vs TransUnion

Who Generates Higher Gross Profit? Cintas Corporation or AerCap Holdings N.V.
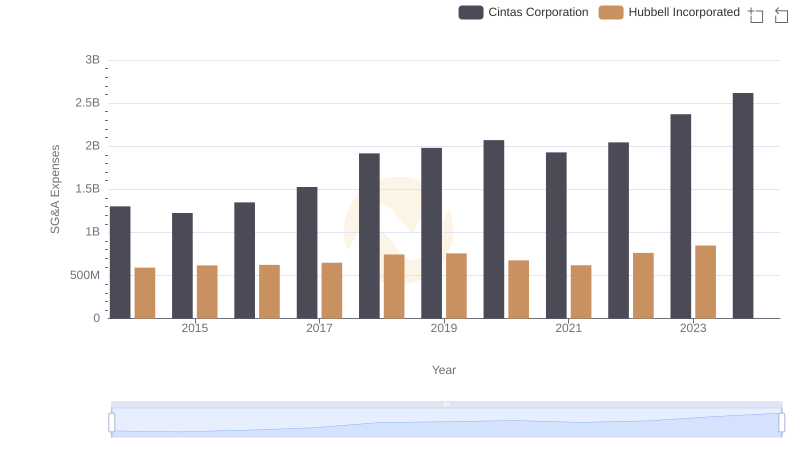
SG&A Efficiency Analysis: Comparing Cintas Corporation and Hubbell Incorporated
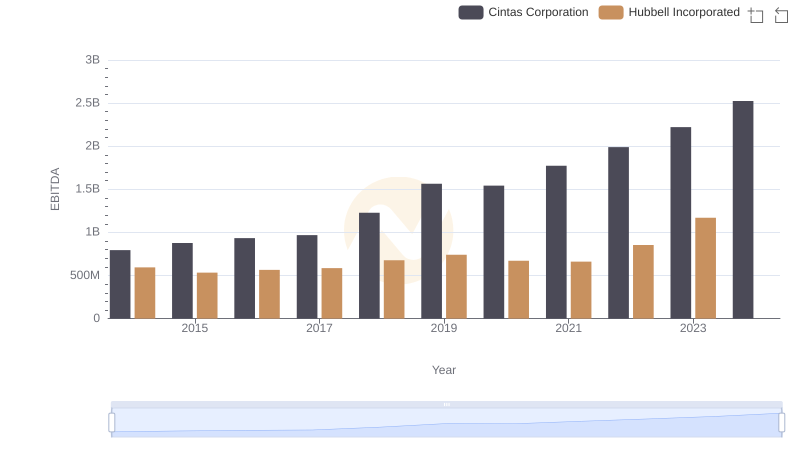
EBITDA Metrics Evaluated: Cintas Corporation vs Hubbell Incorporated