| __timestamp | Cintas Corporation | Watsco, Inc. |
|---|---|---|
| Wednesday, January 1, 2014 | 1914386000 | 956402000 |
| Thursday, January 1, 2015 | 1921337000 | 1007357000 |
| Friday, January 1, 2016 | 2129870000 | 1034584000 |
| Sunday, January 1, 2017 | 2380295000 | 1065659000 |
| Monday, January 1, 2018 | 2908523000 | 1120252000 |
| Tuesday, January 1, 2019 | 3128588000 | 1156956000 |
| Wednesday, January 1, 2020 | 3233748000 | 1222821000 |
| Friday, January 1, 2021 | 3314651000 | 1667545000 |
| Saturday, January 1, 2022 | 3632246000 | 2030289000 |
| Sunday, January 1, 2023 | 4173368000 | 1992140000 |
| Monday, January 1, 2024 | 4686416000 | 2044713000 |
Infusing magic into the data realm
In the ever-evolving landscape of corporate finance, understanding gross profit trends is crucial for investors and analysts alike. This analysis delves into the financial performance of two industry giants, Cintas Corporation and Watsco, Inc., from 2014 to 2023. Over this decade, Cintas Corporation has demonstrated a robust growth trajectory, with its gross profit surging by approximately 145%, from $1.9 billion in 2014 to an impressive $4.2 billion in 2023. In contrast, Watsco, Inc. experienced a more modest increase of around 108%, peaking at $2 billion in 2022. Notably, data for Watsco, Inc. in 2024 is unavailable, highlighting a gap in the financial narrative. This comparative analysis underscores the dynamic nature of these companies' financial health, offering valuable insights for stakeholders seeking to navigate the complexities of the stock market.
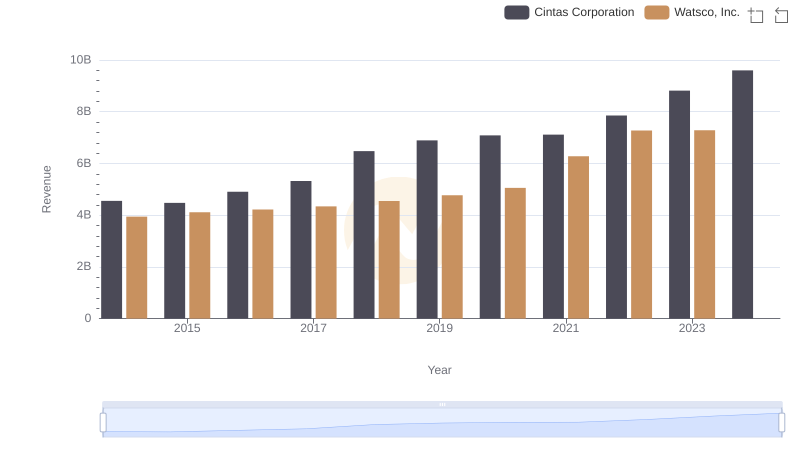
Cintas Corporation vs Watsco, Inc.: Examining Key Revenue Metrics
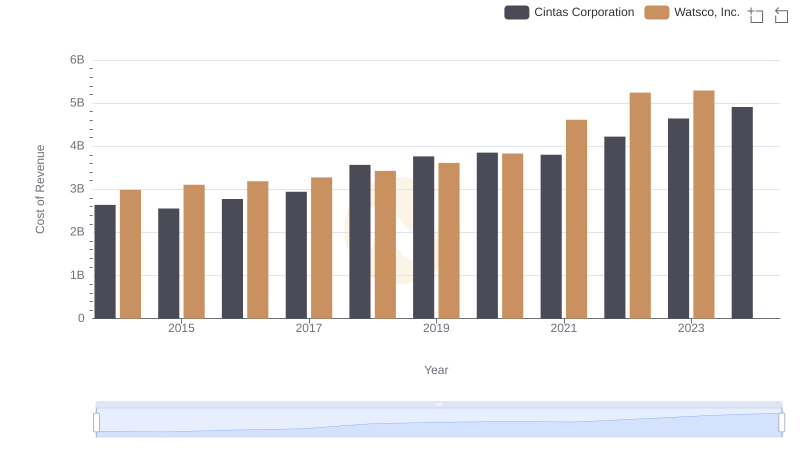
Cost of Revenue: Key Insights for Cintas Corporation and Watsco, Inc.
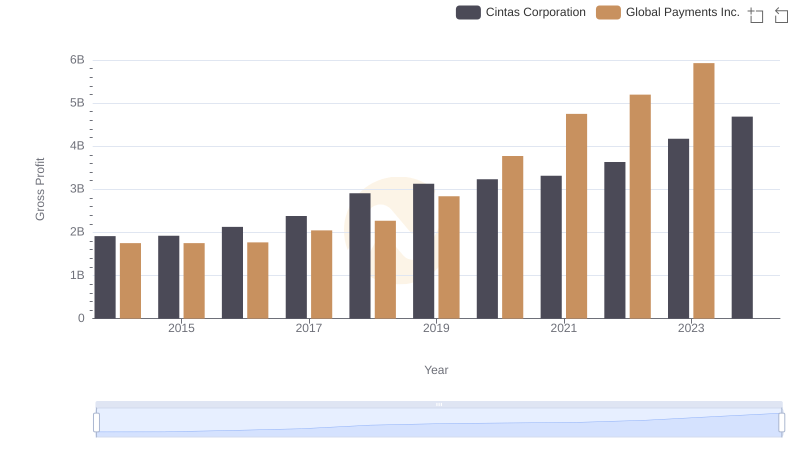
Who Generates Higher Gross Profit? Cintas Corporation or Global Payments Inc.
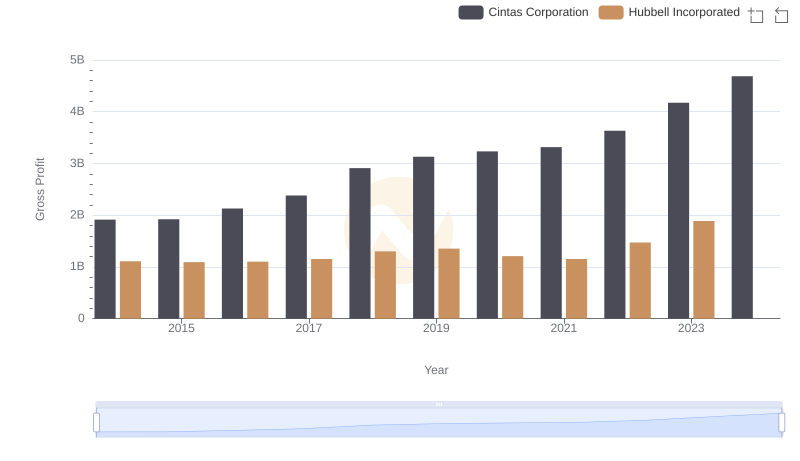
Gross Profit Comparison: Cintas Corporation and Hubbell Incorporated Trends
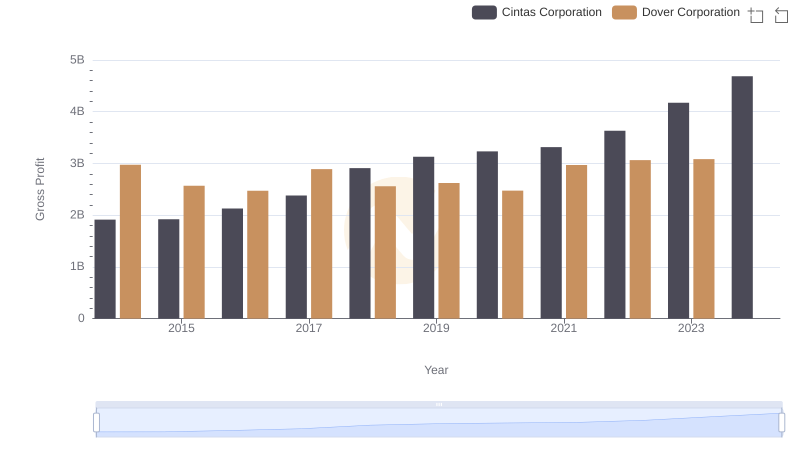
Gross Profit Analysis: Comparing Cintas Corporation and Dover Corporation
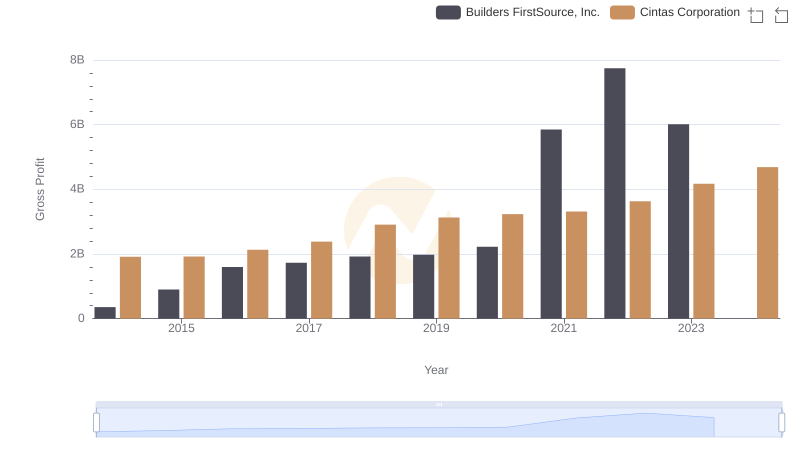
Key Insights on Gross Profit: Cintas Corporation vs Builders FirstSource, Inc.
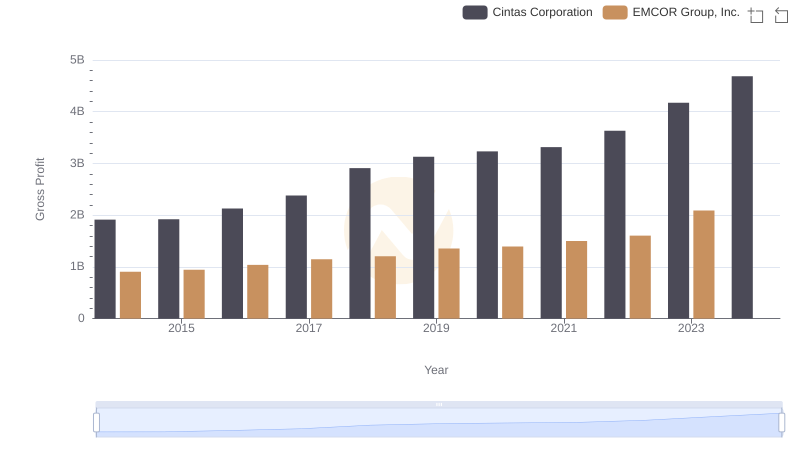
Gross Profit Trends Compared: Cintas Corporation vs EMCOR Group, Inc.
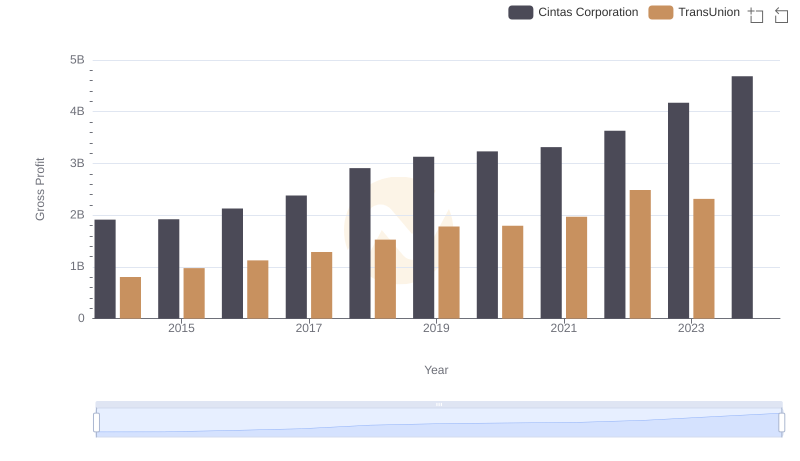
Gross Profit Trends Compared: Cintas Corporation vs TransUnion
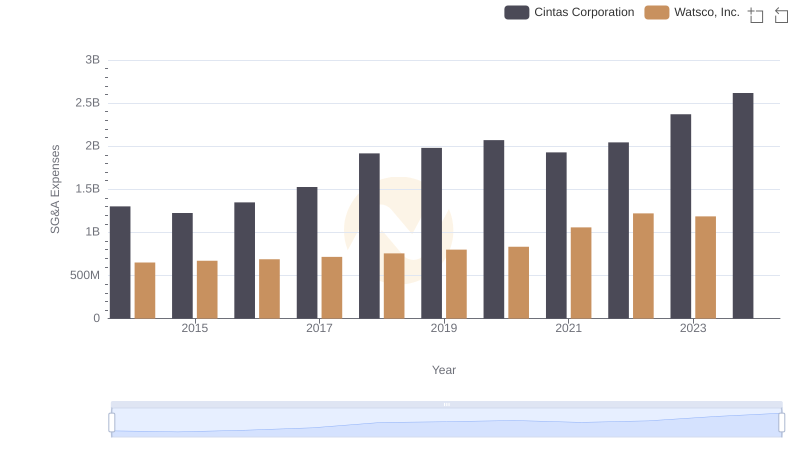
Cintas Corporation vs Watsco, Inc.: SG&A Expense Trends

Who Generates Higher Gross Profit? Cintas Corporation or AerCap Holdings N.V.
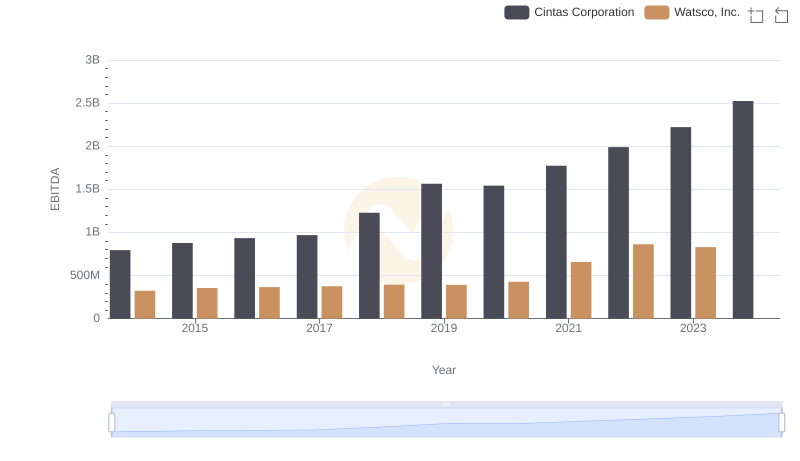
Cintas Corporation and Watsco, Inc.: A Detailed Examination of EBITDA Performance