| __timestamp | Cintas Corporation | EMCOR Group, Inc. |
|---|---|---|
| Wednesday, January 1, 2014 | 1914386000 | 907246000 |
| Thursday, January 1, 2015 | 1921337000 | 944479000 |
| Friday, January 1, 2016 | 2129870000 | 1037862000 |
| Sunday, January 1, 2017 | 2380295000 | 1147012000 |
| Monday, January 1, 2018 | 2908523000 | 1205453000 |
| Tuesday, January 1, 2019 | 3128588000 | 1355868000 |
| Wednesday, January 1, 2020 | 3233748000 | 1395382000 |
| Friday, January 1, 2021 | 3314651000 | 1501737000 |
| Saturday, January 1, 2022 | 3632246000 | 1603594000 |
| Sunday, January 1, 2023 | 4173368000 | 2089339000 |
| Monday, January 1, 2024 | 4686416000 |
Infusing magic into the data realm
In the competitive landscape of the service industry, Cintas Corporation and EMCOR Group, Inc. have shown distinct trajectories in their gross profit trends over the past decade. Since 2014, Cintas has consistently outperformed EMCOR, with its gross profit growing by approximately 145% by 2023. This remarkable growth reflects Cintas's strategic expansions and operational efficiencies. In contrast, EMCOR's gross profit increased by about 130% over the same period, showcasing its resilience and adaptability in a dynamic market. Notably, Cintas's gross profit surged from 2019 to 2023, indicating a robust recovery and growth post-pandemic. However, data for 2024 is incomplete, leaving room for speculation on future trends. As these industry giants continue to evolve, their financial trajectories offer valuable insights into their strategic priorities and market positioning.
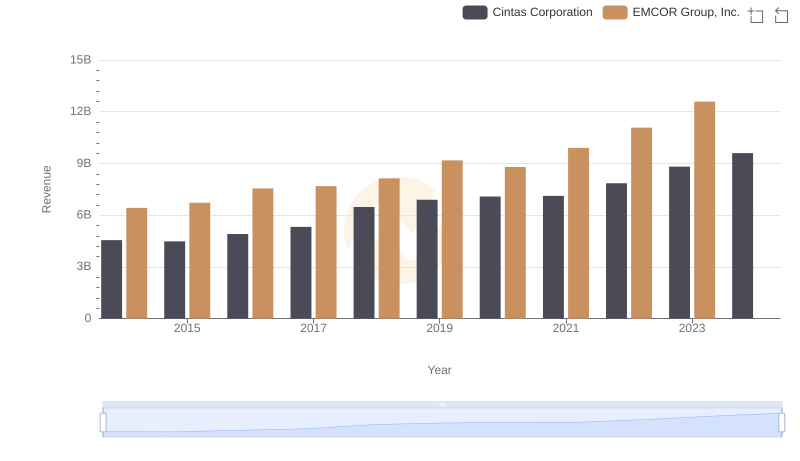
Cintas Corporation or EMCOR Group, Inc.: Who Leads in Yearly Revenue?
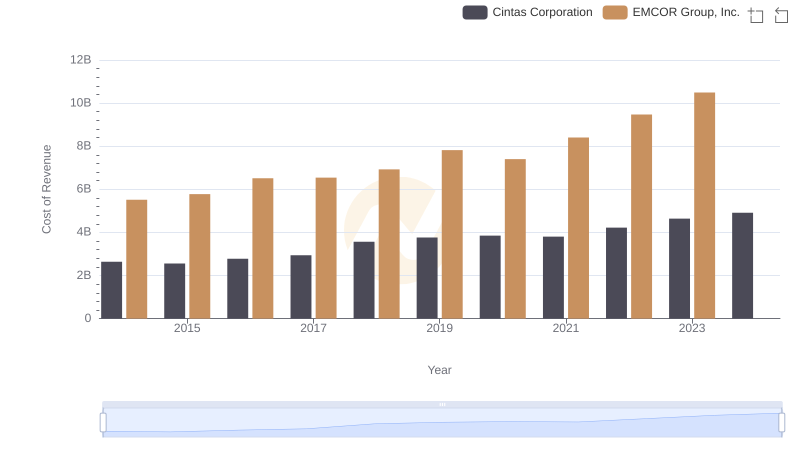
Comparing Cost of Revenue Efficiency: Cintas Corporation vs EMCOR Group, Inc.
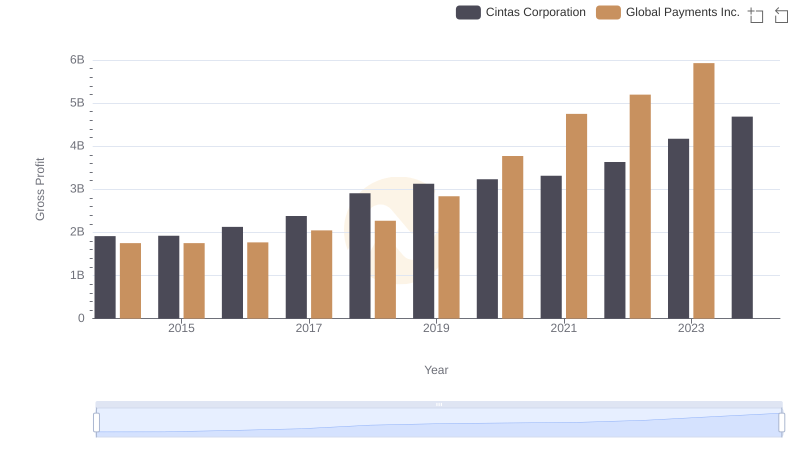
Who Generates Higher Gross Profit? Cintas Corporation or Global Payments Inc.
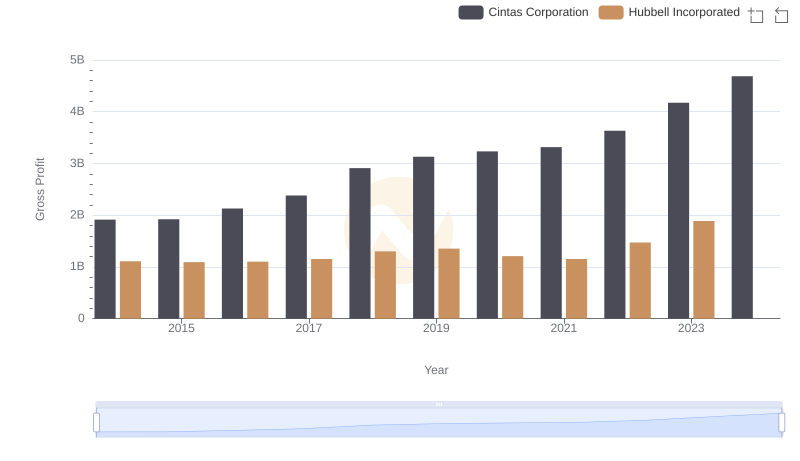
Gross Profit Comparison: Cintas Corporation and Hubbell Incorporated Trends
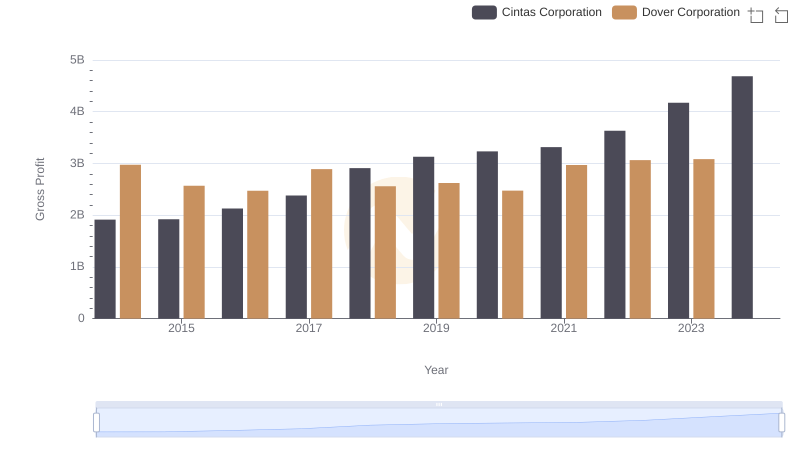
Gross Profit Analysis: Comparing Cintas Corporation and Dover Corporation
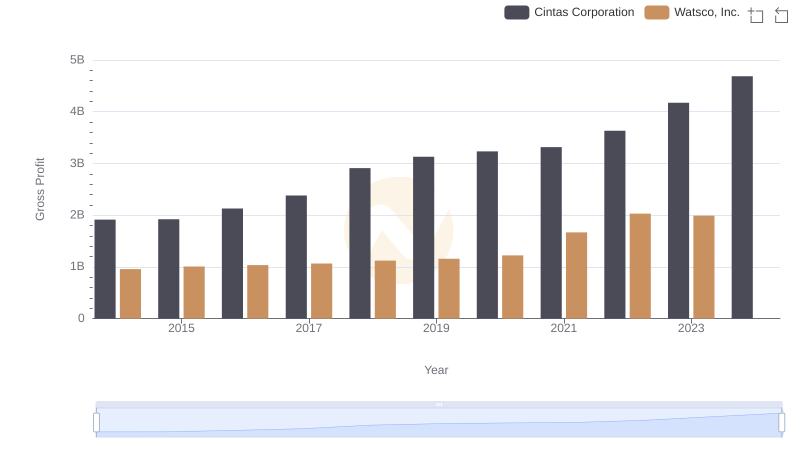
Cintas Corporation and Watsco, Inc.: A Detailed Gross Profit Analysis
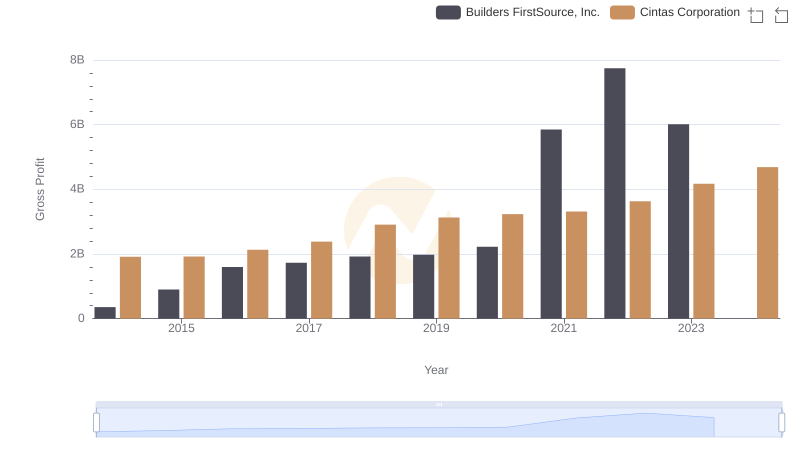
Key Insights on Gross Profit: Cintas Corporation vs Builders FirstSource, Inc.
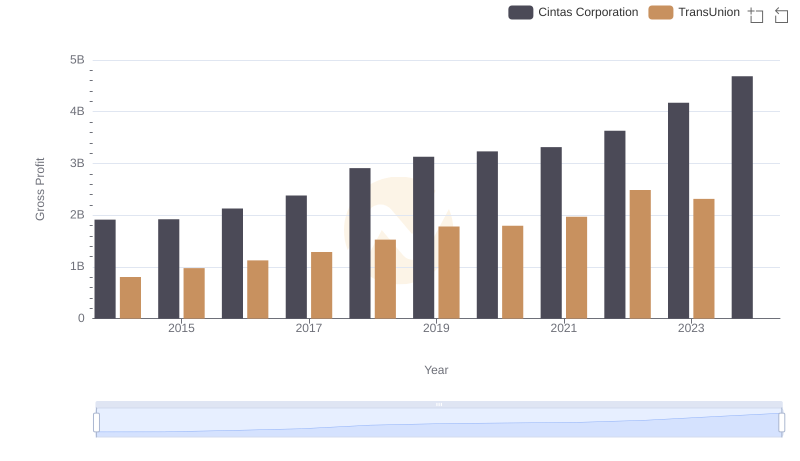
Gross Profit Trends Compared: Cintas Corporation vs TransUnion

Who Generates Higher Gross Profit? Cintas Corporation or AerCap Holdings N.V.
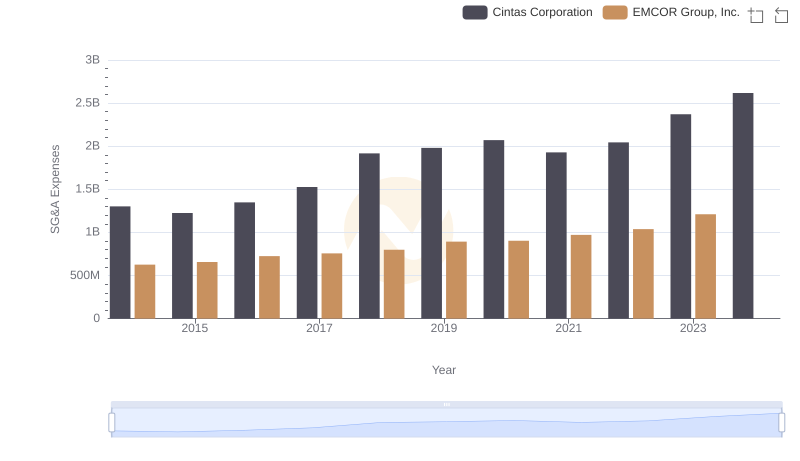
Comparing SG&A Expenses: Cintas Corporation vs EMCOR Group, Inc. Trends and Insights
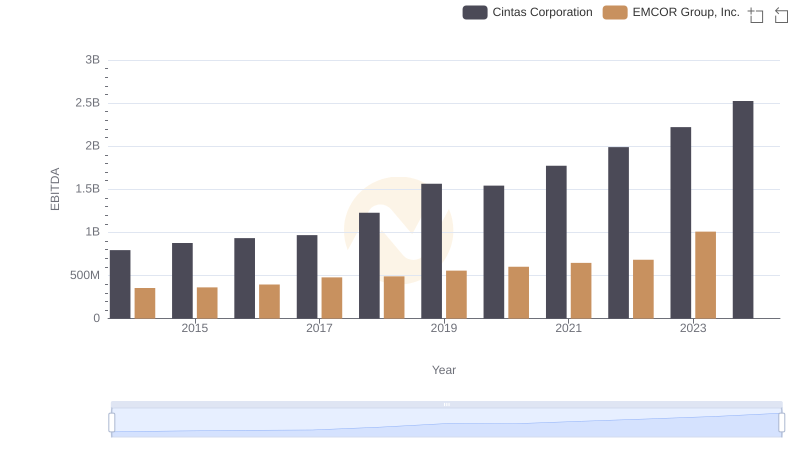
EBITDA Analysis: Evaluating Cintas Corporation Against EMCOR Group, Inc.