| __timestamp | Lennox International Inc. | Waste Management, Inc. |
|---|---|---|
| Wednesday, January 1, 2014 | 3367400000 | 13996000000 |
| Thursday, January 1, 2015 | 3467400000 | 12961000000 |
| Friday, January 1, 2016 | 3641600000 | 13609000000 |
| Sunday, January 1, 2017 | 3839600000 | 14485000000 |
| Monday, January 1, 2018 | 3883900000 | 14914000000 |
| Tuesday, January 1, 2019 | 3807200000 | 15455000000 |
| Wednesday, January 1, 2020 | 3634100000 | 15218000000 |
| Friday, January 1, 2021 | 4194100000 | 17931000000 |
| Saturday, January 1, 2022 | 4718400000 | 19698000000 |
| Sunday, January 1, 2023 | 4981900000 | 20426000000 |
| Monday, January 1, 2024 | 5341300000 | 22063000000 |
Unveiling the hidden dimensions of data
In the ever-evolving landscape of American industry, Waste Management, Inc. and Lennox International Inc. stand as titans in their respective fields. Over the past decade, Waste Management has consistently outperformed Lennox in terms of revenue, showcasing a robust growth trajectory. From 2014 to 2023, Waste Management's revenue surged by approximately 46%, peaking at over $20 billion in 2023. In contrast, Lennox International, a leader in climate control solutions, experienced a steady revenue increase of about 59% during the same period, reaching nearly $5 billion in 2023.
The data reveals a fascinating narrative of resilience and adaptation. Waste Management's dominance is evident, yet Lennox's growth rate is noteworthy, reflecting its strategic market expansions. However, the absence of 2024 data for Waste Management suggests potential market shifts or reporting delays, inviting speculation and further analysis.
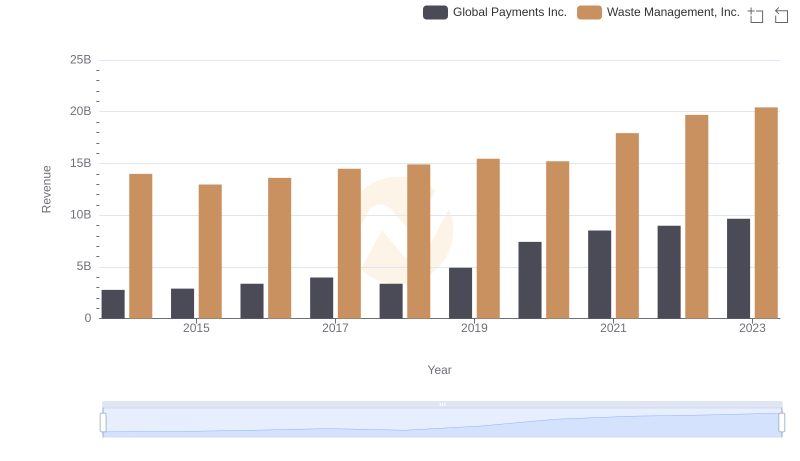
Revenue Showdown: Waste Management, Inc. vs Global Payments Inc.
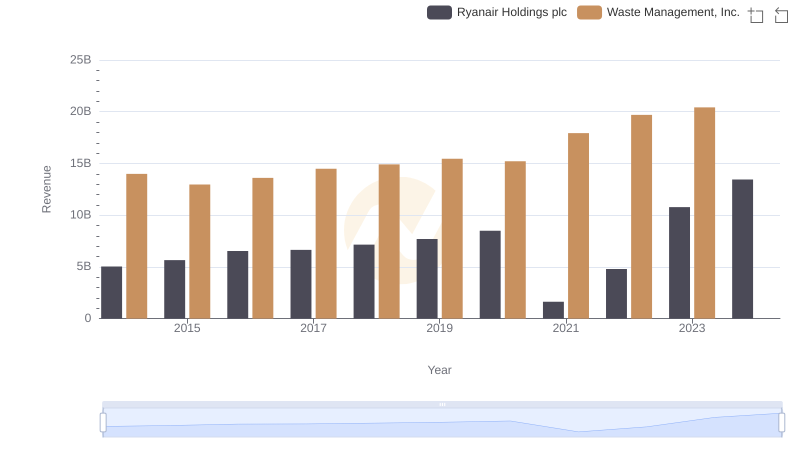
Waste Management, Inc. or Ryanair Holdings plc: Who Leads in Yearly Revenue?
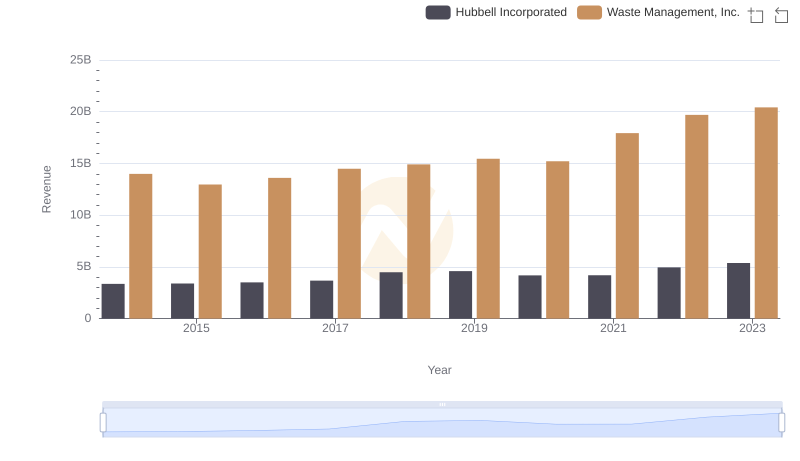
Waste Management, Inc. vs Hubbell Incorporated: Annual Revenue Growth Compared
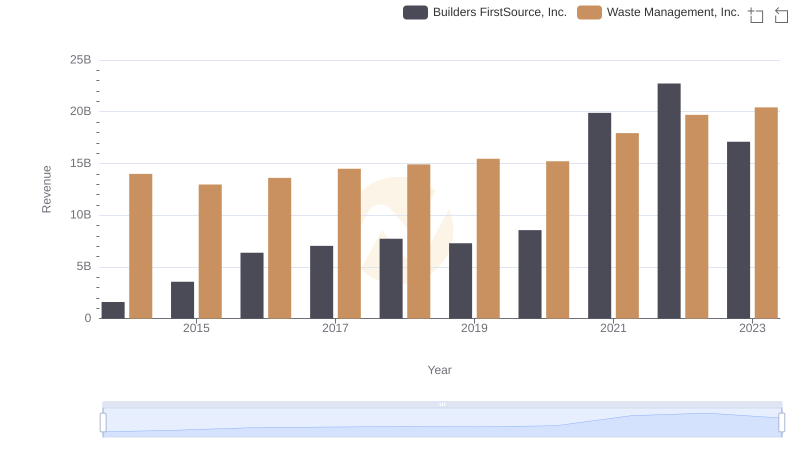
Breaking Down Revenue Trends: Waste Management, Inc. vs Builders FirstSource, Inc.
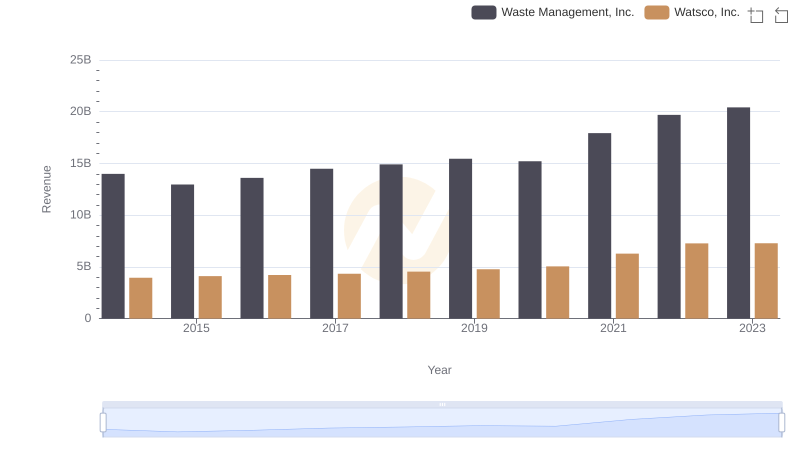
Revenue Showdown: Waste Management, Inc. vs Watsco, Inc.
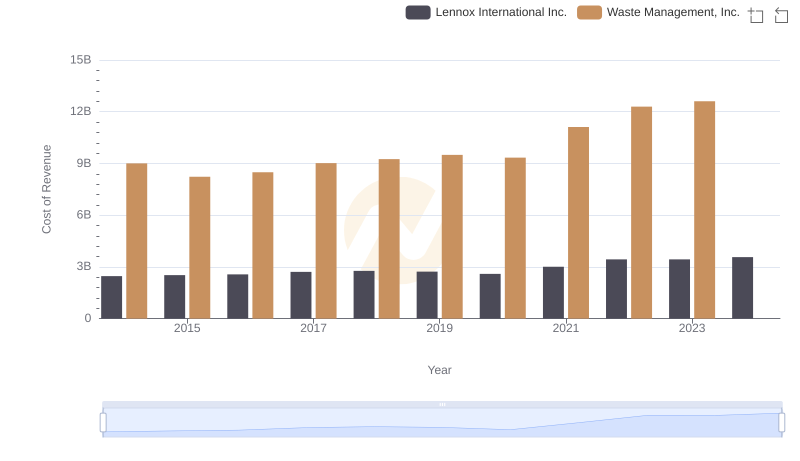
Cost Insights: Breaking Down Waste Management, Inc. and Lennox International Inc.'s Expenses
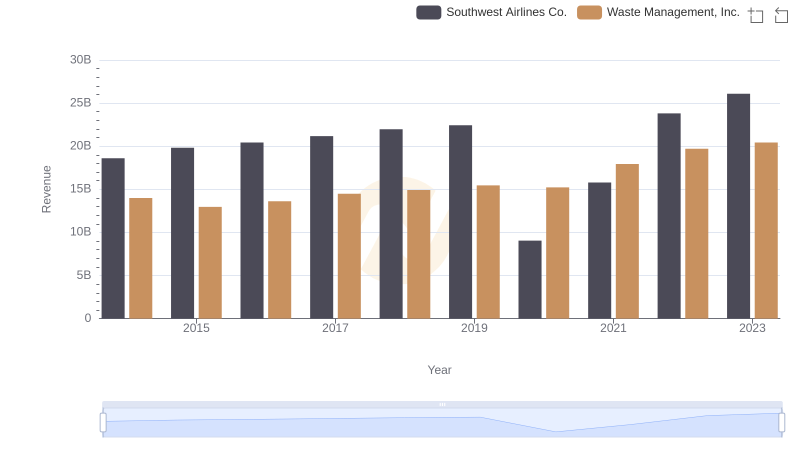
Revenue Insights: Waste Management, Inc. and Southwest Airlines Co. Performance Compared
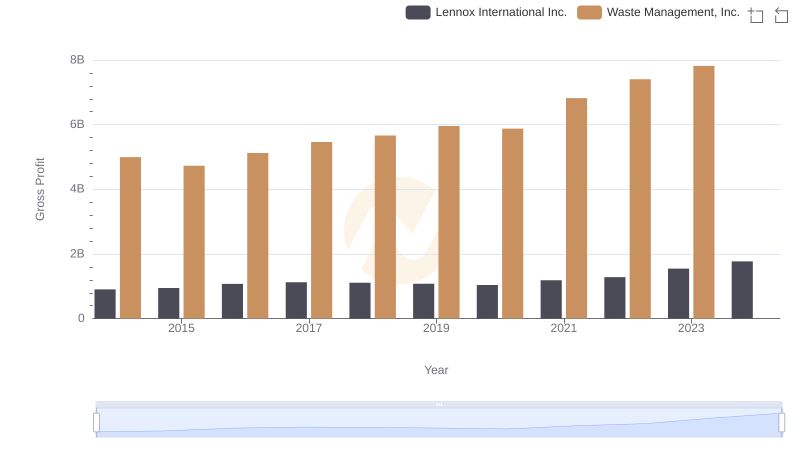
Gross Profit Comparison: Waste Management, Inc. and Lennox International Inc. Trends
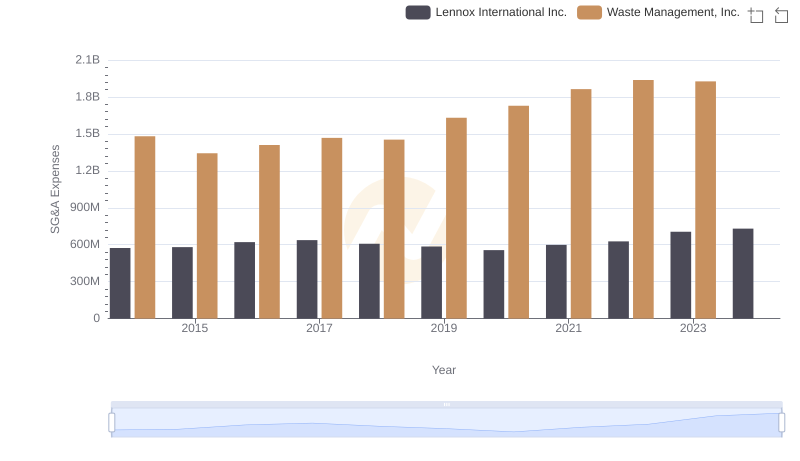
Waste Management, Inc. vs Lennox International Inc.: SG&A Expense Trends
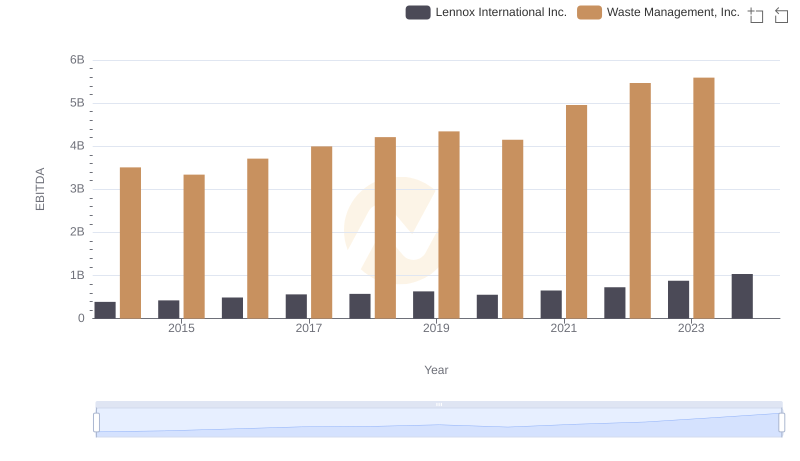
A Side-by-Side Analysis of EBITDA: Waste Management, Inc. and Lennox International Inc.