| __timestamp | Lennox International Inc. | Waste Management, Inc. |
|---|---|---|
| Wednesday, January 1, 2014 | 573700000 | 1481000000 |
| Thursday, January 1, 2015 | 580500000 | 1343000000 |
| Friday, January 1, 2016 | 621000000 | 1410000000 |
| Sunday, January 1, 2017 | 637700000 | 1468000000 |
| Monday, January 1, 2018 | 608200000 | 1453000000 |
| Tuesday, January 1, 2019 | 585900000 | 1631000000 |
| Wednesday, January 1, 2020 | 555900000 | 1728000000 |
| Friday, January 1, 2021 | 598900000 | 1864000000 |
| Saturday, January 1, 2022 | 627200000 | 1938000000 |
| Sunday, January 1, 2023 | 705500000 | 1926000000 |
| Monday, January 1, 2024 | 730600000 | 2264000000 |
Unveiling the hidden dimensions of data
In the ever-evolving landscape of corporate finance, understanding the trends in Selling, General, and Administrative (SG&A) expenses is crucial for investors and analysts alike. Over the past decade, Waste Management, Inc. and Lennox International Inc. have shown distinct trajectories in their SG&A expenses.
From 2014 to 2023, Waste Management, Inc. experienced a steady increase in SG&A expenses, peaking in 2022 with a 31% rise from 2014. This trend reflects the company's strategic investments in operational efficiency and customer service. Conversely, Lennox International Inc. saw a more volatile pattern, with a notable 27% increase in 2023 compared to 2014, indicating a focus on innovation and market expansion.
Interestingly, data for Waste Management, Inc. in 2024 is missing, leaving room for speculation on future financial strategies. These insights provide a window into the financial health and strategic priorities of these industry leaders.

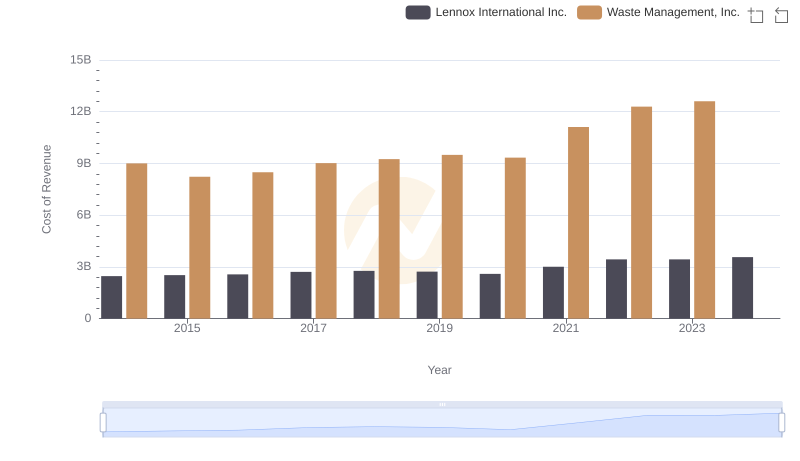
Breaking Down Revenue Trends: Waste Management, Inc. vs Lennox International Inc.
Cost Insights: Breaking Down Waste Management, Inc. and Lennox International Inc.'s Expenses
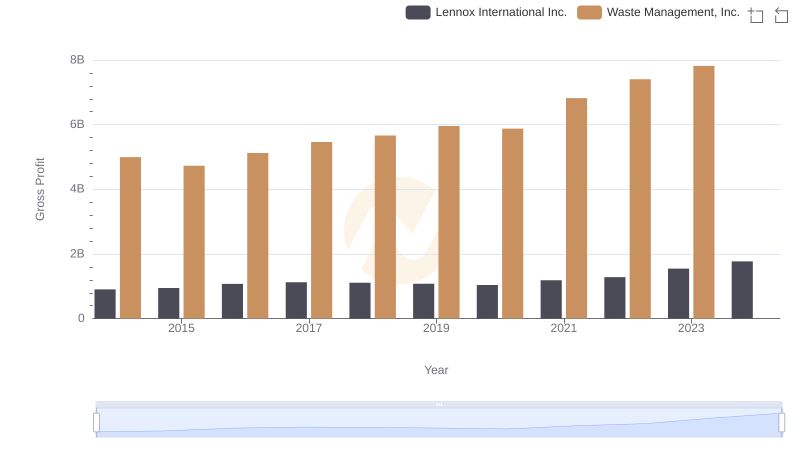
Gross Profit Comparison: Waste Management, Inc. and Lennox International Inc. Trends
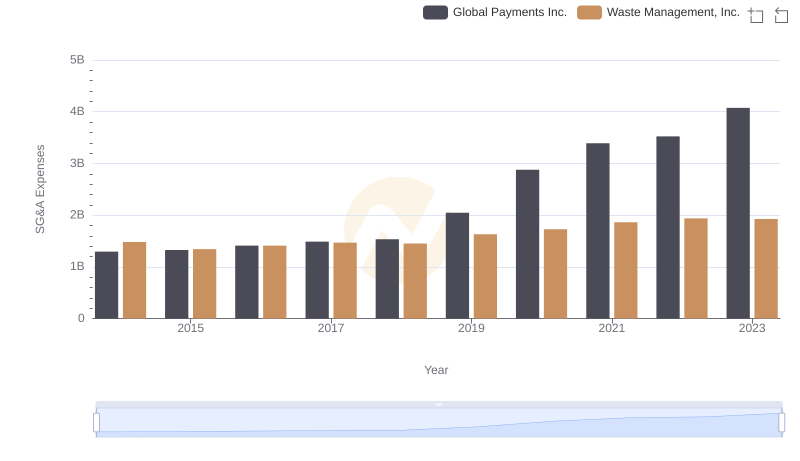
Waste Management, Inc. vs Global Payments Inc.: SG&A Expense Trends
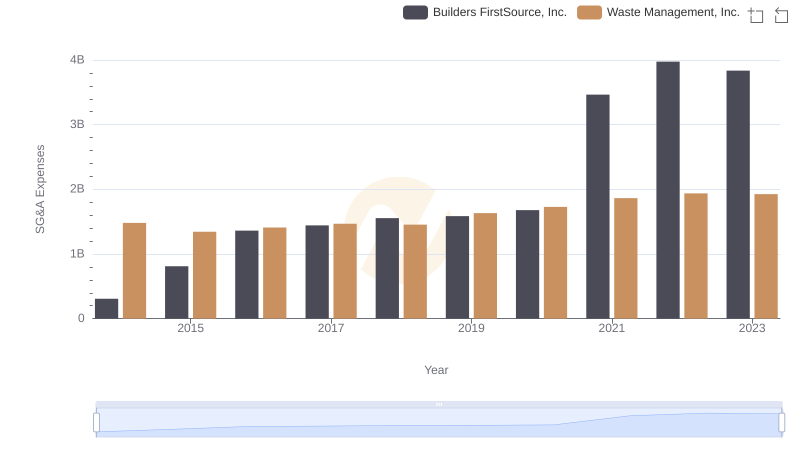
Who Optimizes SG&A Costs Better? Waste Management, Inc. or Builders FirstSource, Inc.
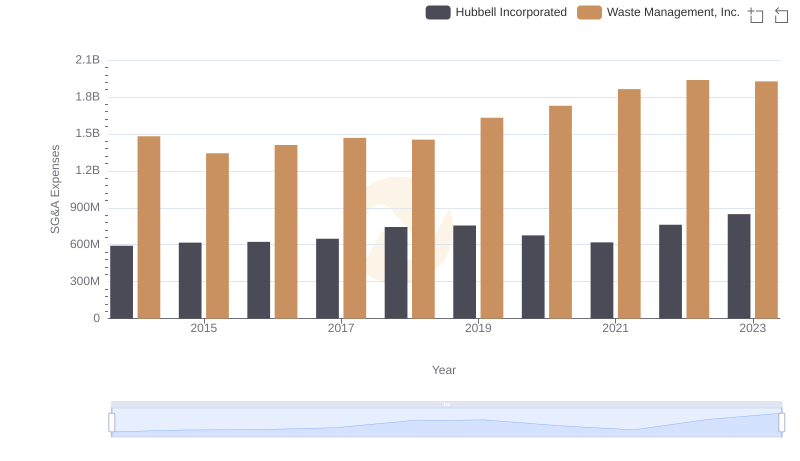
Waste Management, Inc. and Hubbell Incorporated: SG&A Spending Patterns Compared
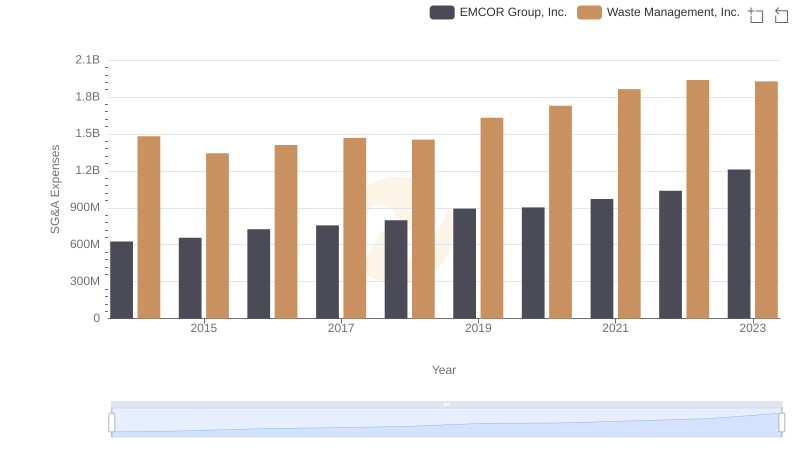
Waste Management, Inc. and EMCOR Group, Inc.: SG&A Spending Patterns Compared
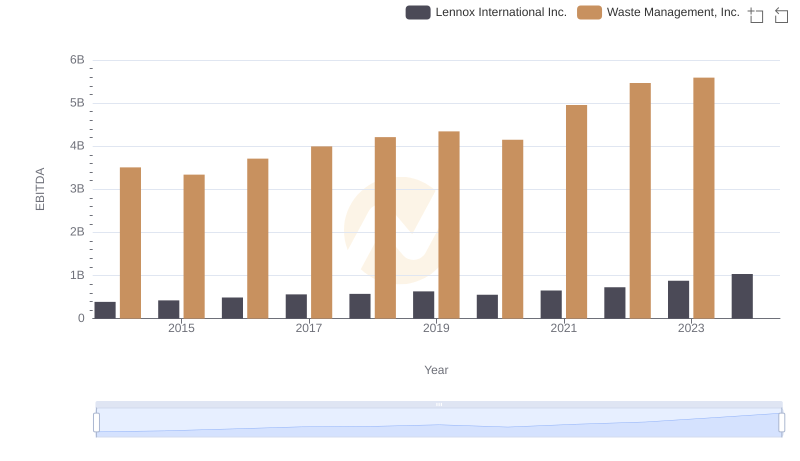
A Side-by-Side Analysis of EBITDA: Waste Management, Inc. and Lennox International Inc.