| __timestamp | Lennox International Inc. | Waste Management, Inc. |
|---|---|---|
| Wednesday, January 1, 2014 | 2464100000 | 9002000000 |
| Thursday, January 1, 2015 | 2520000000 | 8231000000 |
| Friday, January 1, 2016 | 2565100000 | 8486000000 |
| Sunday, January 1, 2017 | 2714400000 | 9021000000 |
| Monday, January 1, 2018 | 2772700000 | 9249000000 |
| Tuesday, January 1, 2019 | 2727400000 | 9496000000 |
| Wednesday, January 1, 2020 | 2594000000 | 9341000000 |
| Friday, January 1, 2021 | 3005700000 | 11111000000 |
| Saturday, January 1, 2022 | 3433700000 | 12294000000 |
| Sunday, January 1, 2023 | 3434100000 | 12606000000 |
| Monday, January 1, 2024 | 3569400000 | 13383000000 |
Cracking the code
In the ever-evolving landscape of corporate expenses, understanding cost structures is crucial. Waste Management, Inc. and Lennox International Inc. offer a fascinating glimpse into how two industry giants manage their cost of revenue over the past decade. From 2014 to 2023, Waste Management's cost of revenue surged by approximately 40%, peaking at $12.6 billion in 2023. In contrast, Lennox International saw a more modest increase of around 45%, reaching $3.4 billion in the same year. This divergence highlights the distinct operational strategies of these companies. Waste Management's consistent growth reflects its expansive service model, while Lennox's steady rise underscores its focus on efficiency and innovation. Notably, data for 2024 is incomplete, suggesting potential shifts in these trends. As businesses navigate economic challenges, these insights provide valuable lessons in cost management and strategic planning.

Breaking Down Revenue Trends: Waste Management, Inc. vs Lennox International Inc.
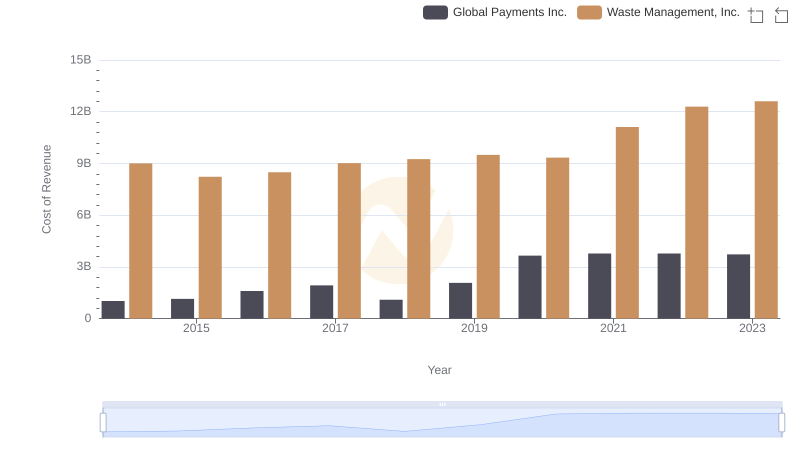
Cost of Revenue Trends: Waste Management, Inc. vs Global Payments Inc.
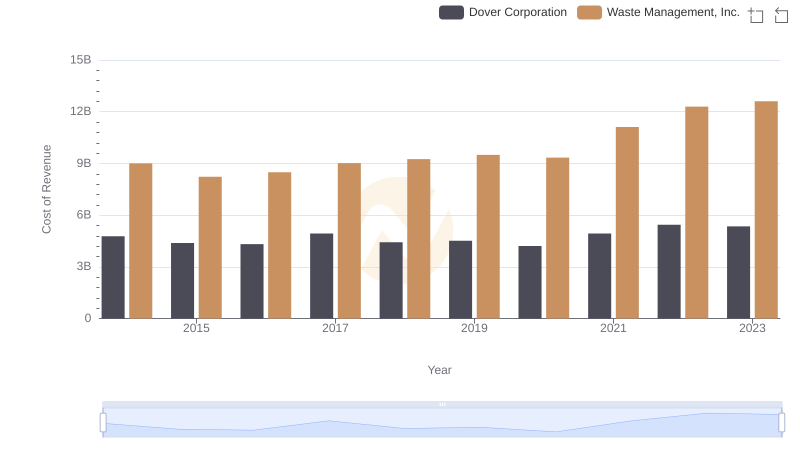
Comparing Cost of Revenue Efficiency: Waste Management, Inc. vs Dover Corporation
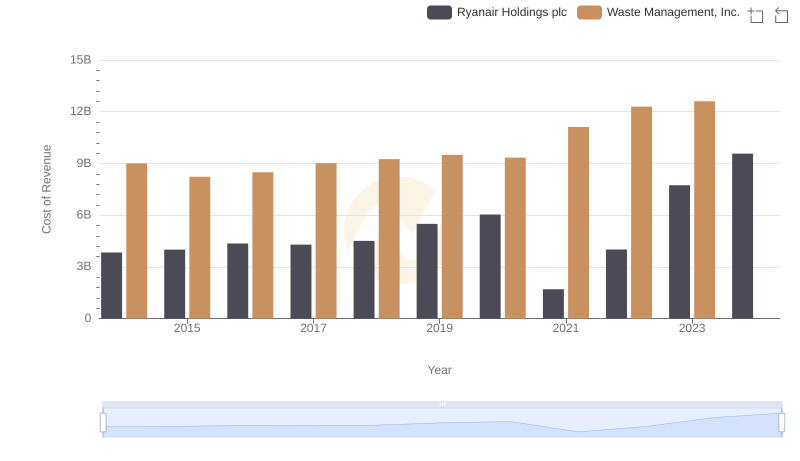
Cost Insights: Breaking Down Waste Management, Inc. and Ryanair Holdings plc's Expenses
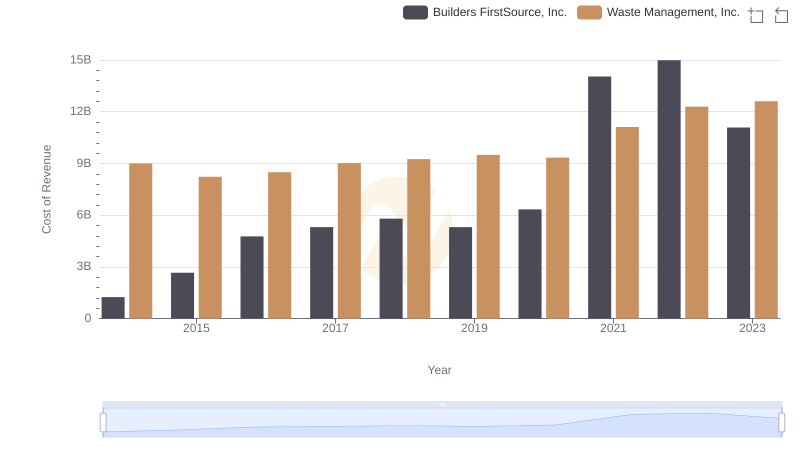
Cost Insights: Breaking Down Waste Management, Inc. and Builders FirstSource, Inc.'s Expenses
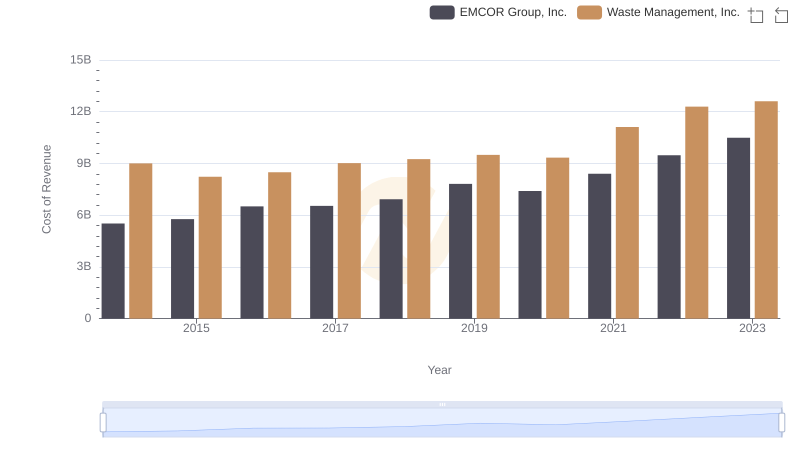
Cost Insights: Breaking Down Waste Management, Inc. and EMCOR Group, Inc.'s Expenses
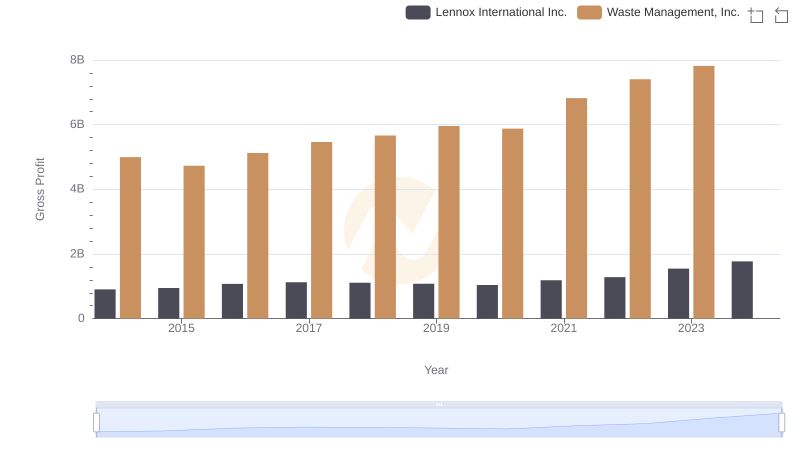
Gross Profit Comparison: Waste Management, Inc. and Lennox International Inc. Trends
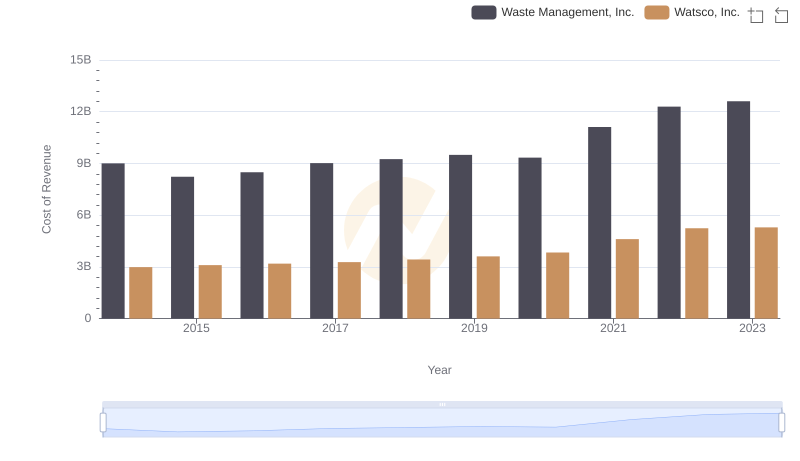
Cost of Revenue Comparison: Waste Management, Inc. vs Watsco, Inc.
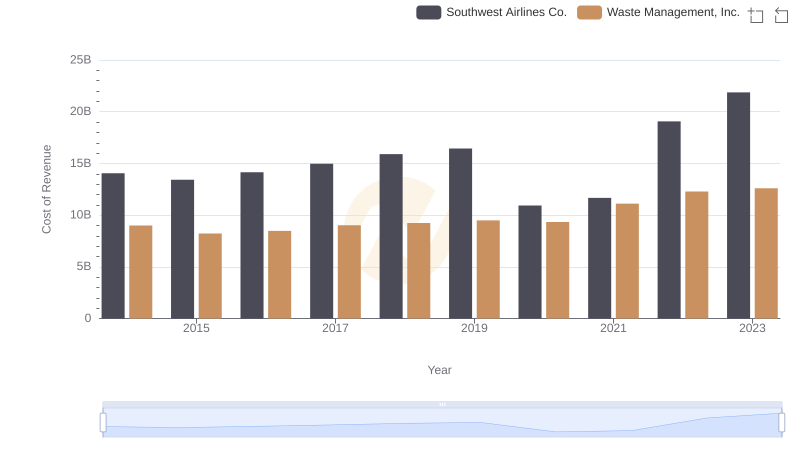
Cost of Revenue Comparison: Waste Management, Inc. vs Southwest Airlines Co.
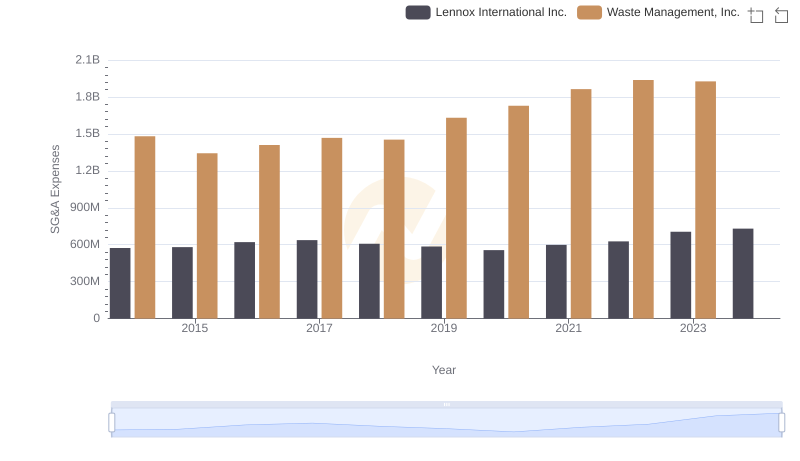
Waste Management, Inc. vs Lennox International Inc.: SG&A Expense Trends
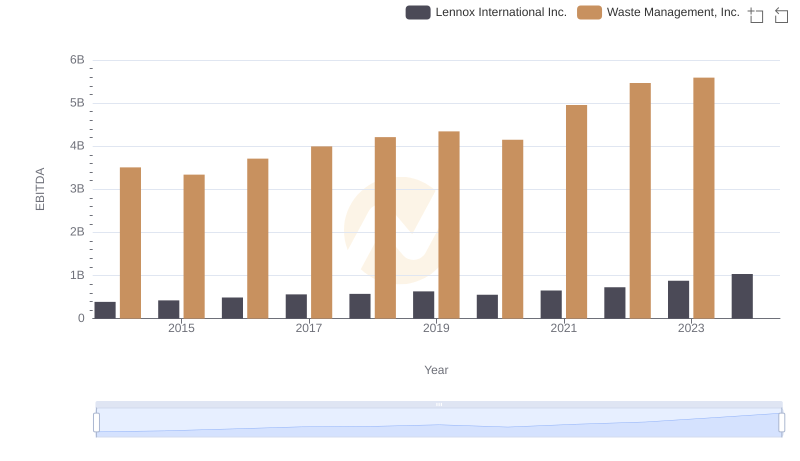
A Side-by-Side Analysis of EBITDA: Waste Management, Inc. and Lennox International Inc.