| __timestamp | Lennox International Inc. | Waste Management, Inc. |
|---|---|---|
| Wednesday, January 1, 2014 | 387700000 | 3509000000 |
| Thursday, January 1, 2015 | 423600000 | 3342000000 |
| Friday, January 1, 2016 | 490800000 | 3713000000 |
| Sunday, January 1, 2017 | 562900000 | 3996000000 |
| Monday, January 1, 2018 | 575200000 | 4212000000 |
| Tuesday, January 1, 2019 | 633300000 | 4344000000 |
| Wednesday, January 1, 2020 | 553900000 | 4149000000 |
| Friday, January 1, 2021 | 652500000 | 4956000000 |
| Saturday, January 1, 2022 | 729000000 | 5466000000 |
| Sunday, January 1, 2023 | 879500000 | 5592000000 |
| Monday, January 1, 2024 | 1034800000 | 5128000000 |
Unveiling the hidden dimensions of data
In the ever-evolving landscape of corporate finance, EBITDA serves as a crucial indicator of a company's operational efficiency. Over the past decade, Waste Management, Inc. and Lennox International Inc. have demonstrated contrasting trajectories in their EBITDA growth. From 2014 to 2023, Waste Management's EBITDA surged by approximately 59%, reflecting its robust market position and strategic expansions. In contrast, Lennox International's EBITDA grew by nearly 168% during the same period, showcasing its aggressive growth strategy and market adaptability.
Interestingly, while Waste Management consistently outperformed Lennox in absolute EBITDA figures, Lennox's growth rate was nearly three times higher, indicating a dynamic shift in its operational strategy. The data for 2024 remains incomplete, highlighting the need for continuous monitoring to capture emerging trends. This analysis underscores the importance of strategic planning and market responsiveness in achieving sustainable financial growth.

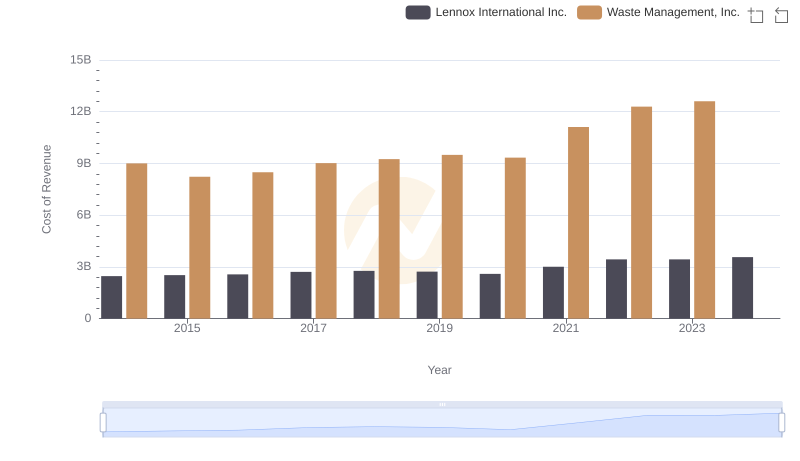
Breaking Down Revenue Trends: Waste Management, Inc. vs Lennox International Inc.
Cost Insights: Breaking Down Waste Management, Inc. and Lennox International Inc.'s Expenses
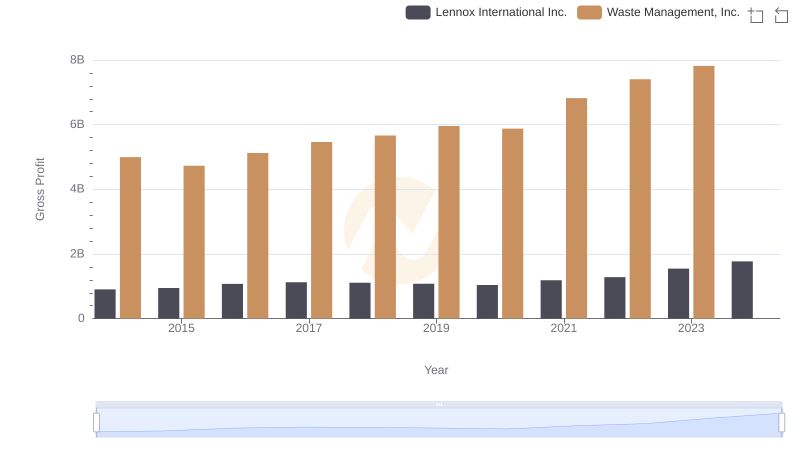
Gross Profit Comparison: Waste Management, Inc. and Lennox International Inc. Trends
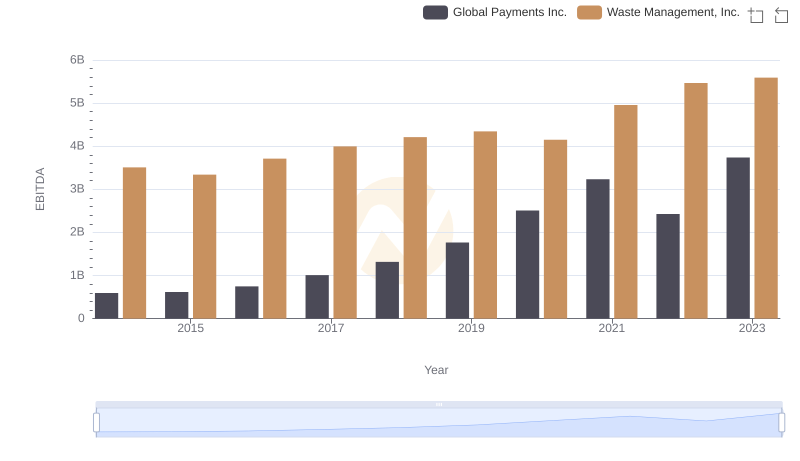
A Professional Review of EBITDA: Waste Management, Inc. Compared to Global Payments Inc.
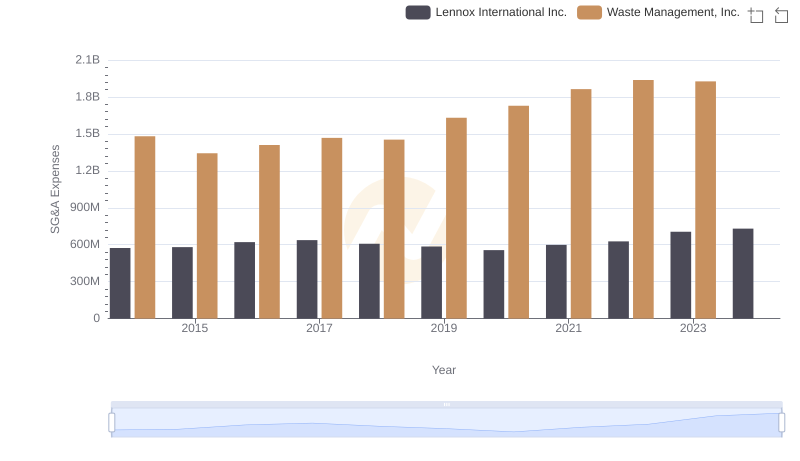
Waste Management, Inc. vs Lennox International Inc.: SG&A Expense Trends
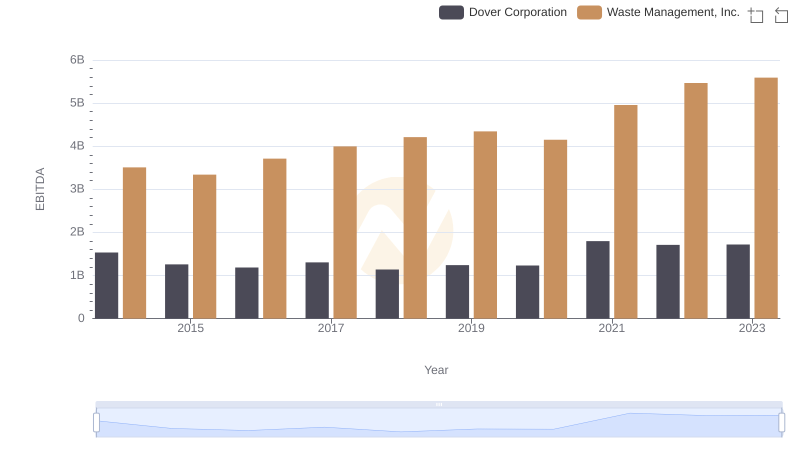
EBITDA Performance Review: Waste Management, Inc. vs Dover Corporation
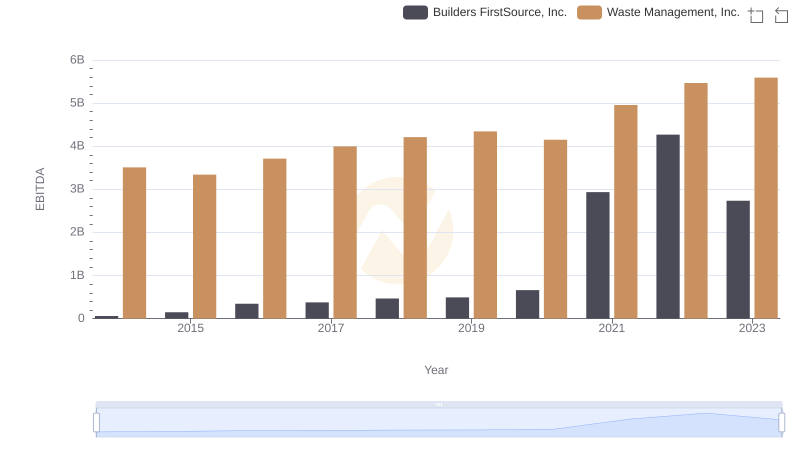
EBITDA Performance Review: Waste Management, Inc. vs Builders FirstSource, Inc.
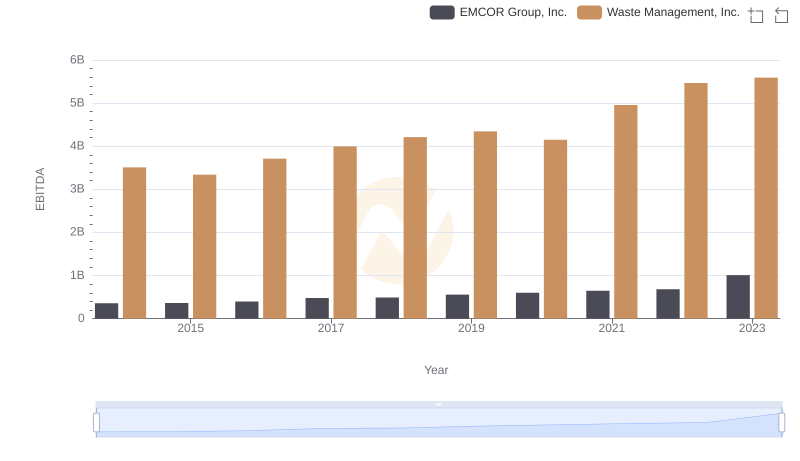
Comprehensive EBITDA Comparison: Waste Management, Inc. vs EMCOR Group, Inc.
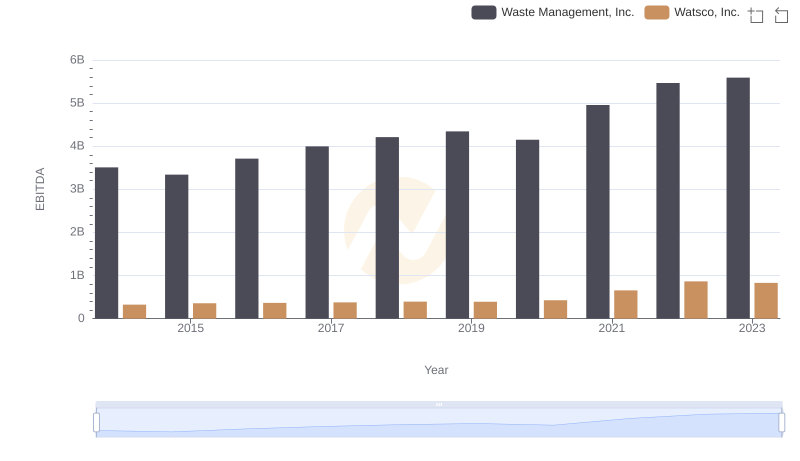
Professional EBITDA Benchmarking: Waste Management, Inc. vs Watsco, Inc.