| __timestamp | Intuit Inc. | Workday, Inc. |
|---|---|---|
| Wednesday, January 1, 2014 | 3838000000 | 292128000 |
| Thursday, January 1, 2015 | 3467000000 | 523057000 |
| Friday, January 1, 2016 | 3942000000 | 787919000 |
| Sunday, January 1, 2017 | 4368000000 | 1085862000 |
| Monday, January 1, 2018 | 4987000000 | 1513637000 |
| Tuesday, January 1, 2019 | 5617000000 | 1987230000 |
| Wednesday, January 1, 2020 | 6301000000 | 2561948000 |
| Friday, January 1, 2021 | 7950000000 | 3119864000 |
| Saturday, January 1, 2022 | 10320000000 | 3710703000 |
| Sunday, January 1, 2023 | 11225000000 | 4500640000 |
| Monday, January 1, 2024 | 12820000000 | 5488000000 |
Unleashing insights
In the ever-evolving landscape of financial technology, Intuit Inc. and Workday, Inc. have emerged as formidable players. Over the past decade, from 2014 to 2024, these companies have demonstrated remarkable growth in gross profit, reflecting their strategic prowess and market adaptability.
Intuit Inc., known for its flagship products like TurboTax and QuickBooks, has seen its gross profit soar by over 230%, from approximately $3.8 billion in 2014 to an impressive $12.8 billion in 2024. This growth underscores Intuit's ability to innovate and capture market share in the competitive fintech sector.
Meanwhile, Workday, Inc., a leader in enterprise cloud applications for finance and human resources, has experienced a staggering 1,780% increase in gross profit, rising from $292 million in 2014 to $5.5 billion in 2024. This exponential growth highlights Workday's successful expansion and adoption across various industries.
As these two giants continue to shape the future of financial technology, their trajectories offer valuable insights into the dynamics of innovation and market leadership.
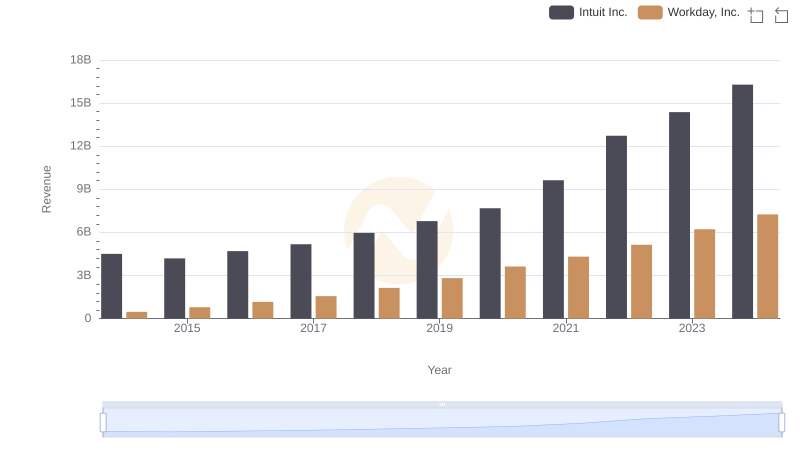
Intuit Inc. vs Workday, Inc.: Annual Revenue Growth Compared
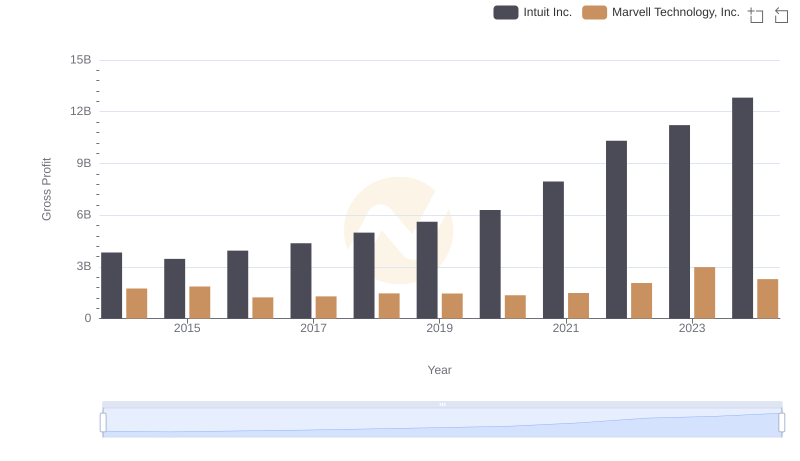
Gross Profit Analysis: Comparing Intuit Inc. and Marvell Technology, Inc.
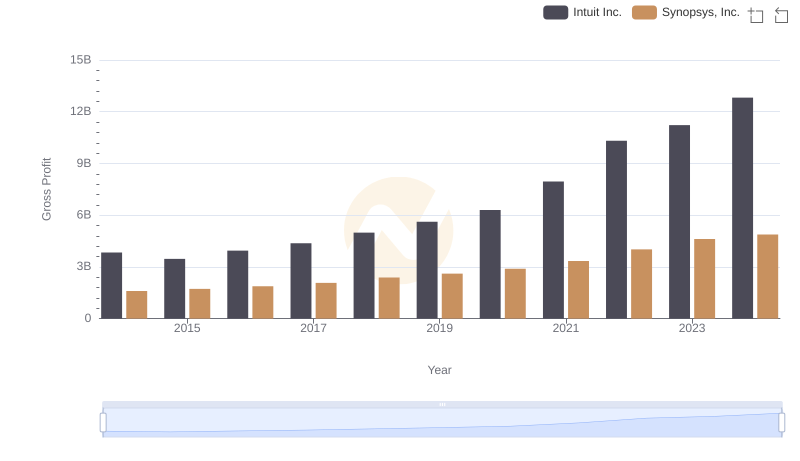
Intuit Inc. and Synopsys, Inc.: A Detailed Gross Profit Analysis
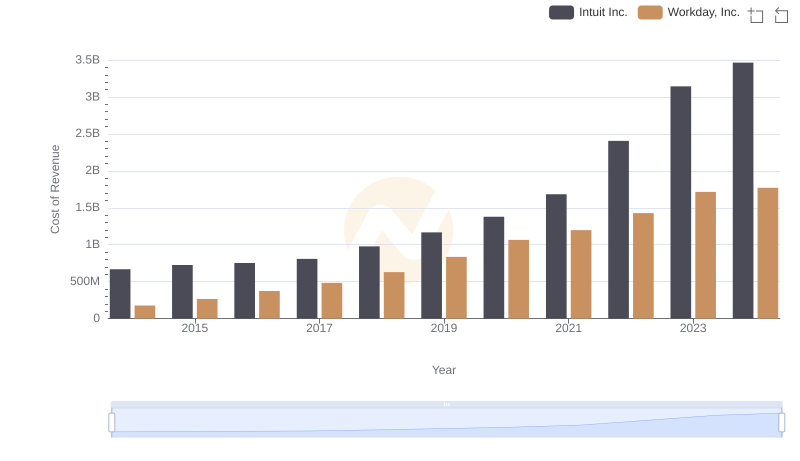
Comparing Cost of Revenue Efficiency: Intuit Inc. vs Workday, Inc.
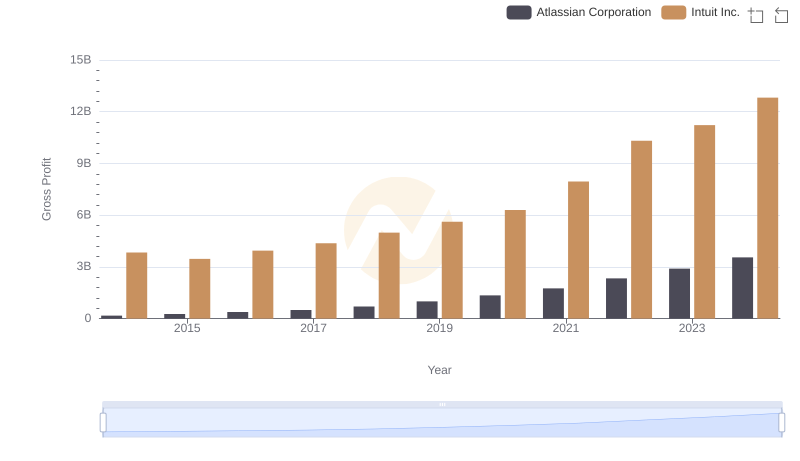
Gross Profit Analysis: Comparing Intuit Inc. and Atlassian Corporation
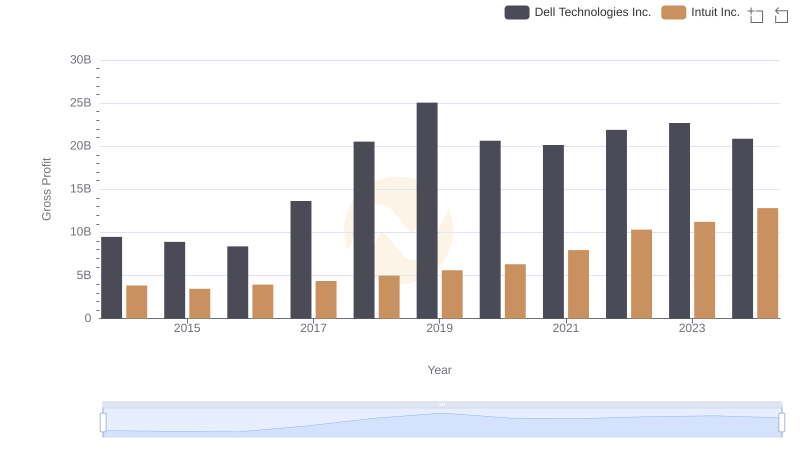
Intuit Inc. and Dell Technologies Inc.: A Detailed Gross Profit Analysis
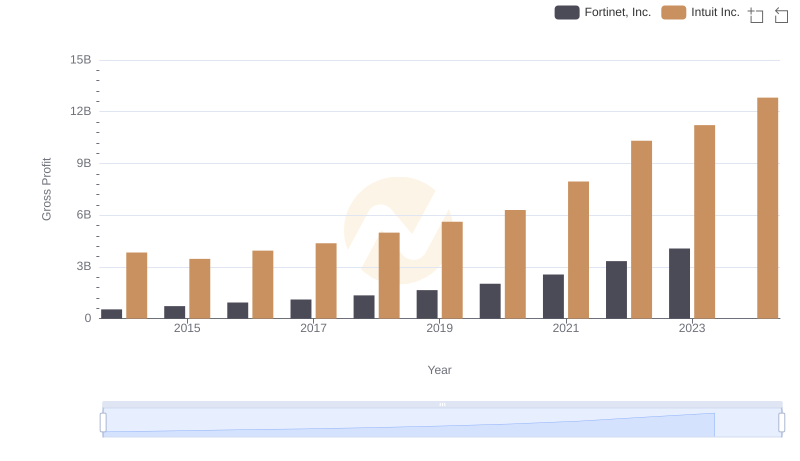
Intuit Inc. vs Fortinet, Inc.: A Gross Profit Performance Breakdown
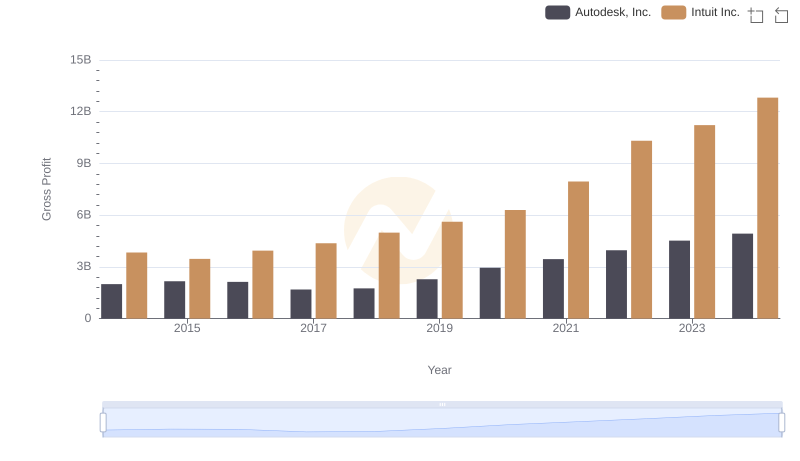
Key Insights on Gross Profit: Intuit Inc. vs Autodesk, Inc.
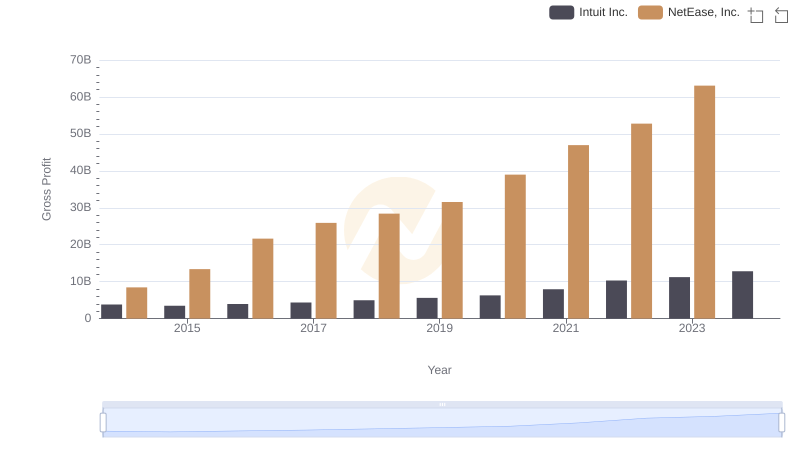
Who Generates Higher Gross Profit? Intuit Inc. or NetEase, Inc.
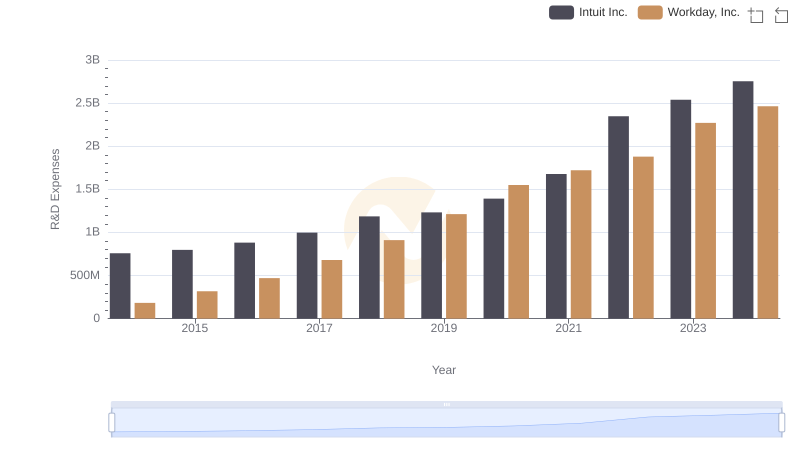
Research and Development Expenses Breakdown: Intuit Inc. vs Workday, Inc.
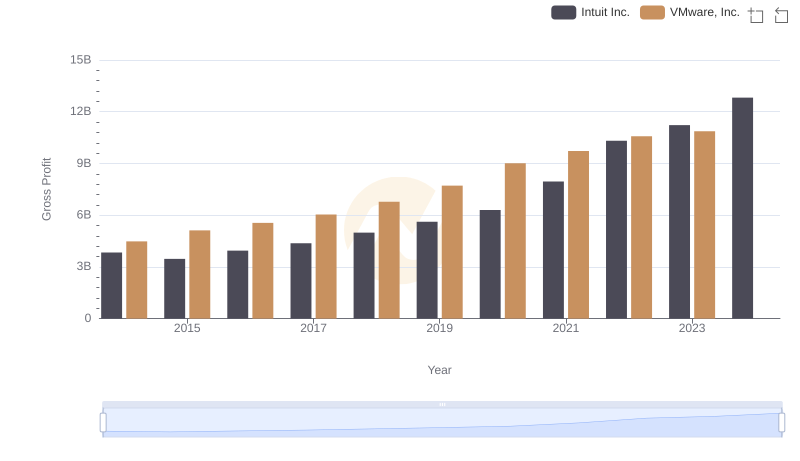
Intuit Inc. and VMware, Inc.: A Detailed Gross Profit Analysis
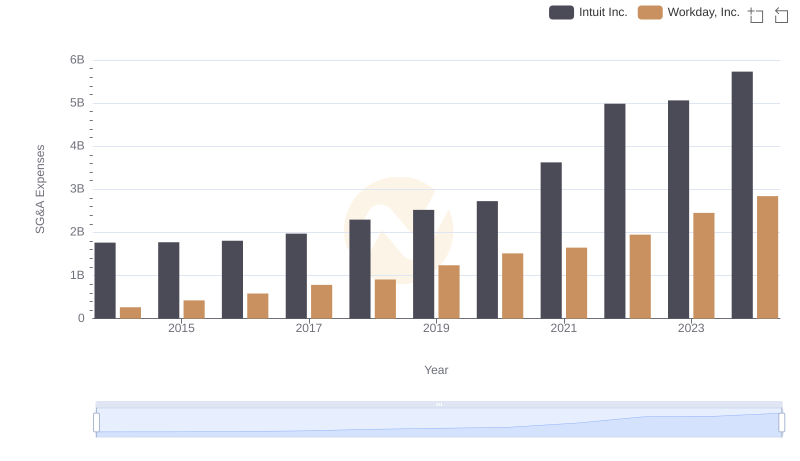
Intuit Inc. and Workday, Inc.: SG&A Spending Patterns Compared