| __timestamp | Autodesk, Inc. | Intuit Inc. |
|---|---|---|
| Wednesday, January 1, 2014 | 1999600000 | 3838000000 |
| Thursday, January 1, 2015 | 2170100000 | 3467000000 |
| Friday, January 1, 2016 | 2133400000 | 3942000000 |
| Sunday, January 1, 2017 | 1689100000 | 4368000000 |
| Monday, January 1, 2018 | 1753200000 | 4987000000 |
| Tuesday, January 1, 2019 | 2283900000 | 5617000000 |
| Wednesday, January 1, 2020 | 2949400000 | 6301000000 |
| Friday, January 1, 2021 | 3453300000 | 7950000000 |
| Saturday, January 1, 2022 | 3967900000 | 10320000000 |
| Sunday, January 1, 2023 | 4525000000 | 11225000000 |
| Monday, January 1, 2024 | 4977000000 | 12820000000 |
Unlocking the unknown
In the ever-evolving landscape of software giants, Intuit Inc. and Autodesk, Inc. have showcased remarkable growth over the past decade. From 2014 to 2024, Intuit's gross profit surged by an impressive 234%, reflecting its robust expansion and strategic market positioning. Meanwhile, Autodesk demonstrated a commendable 146% increase, underscoring its resilience and adaptability in a competitive industry.
These trends not only reflect the companies' financial health but also their strategic foresight in navigating technological advancements and market demands.
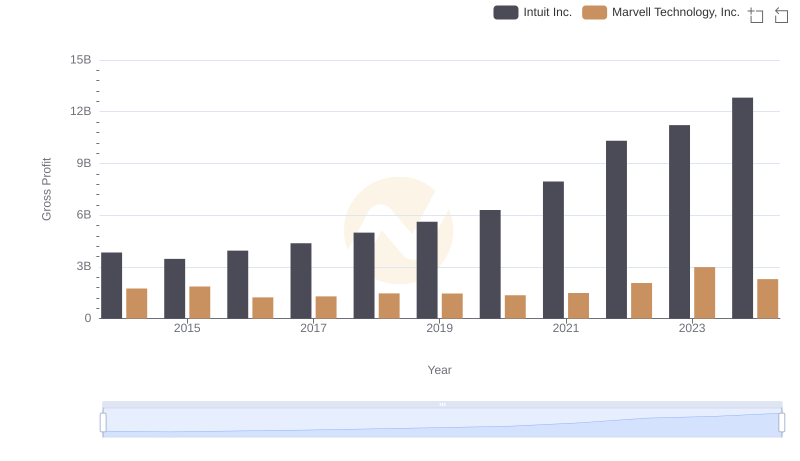
Gross Profit Analysis: Comparing Intuit Inc. and Marvell Technology, Inc.
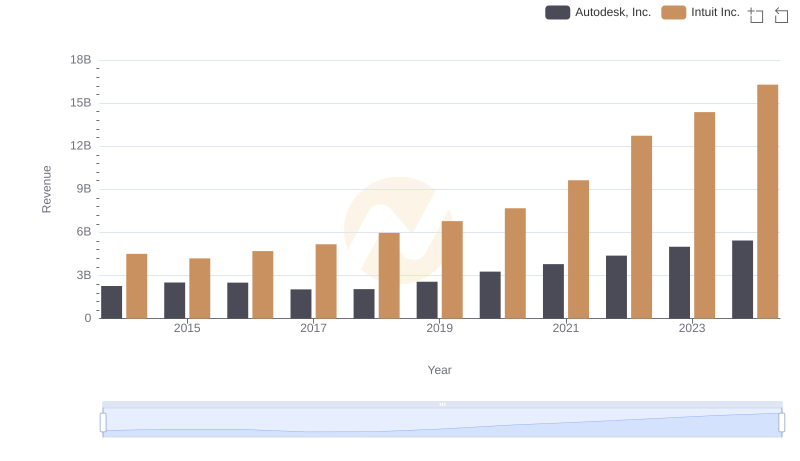
Revenue Showdown: Intuit Inc. vs Autodesk, Inc.
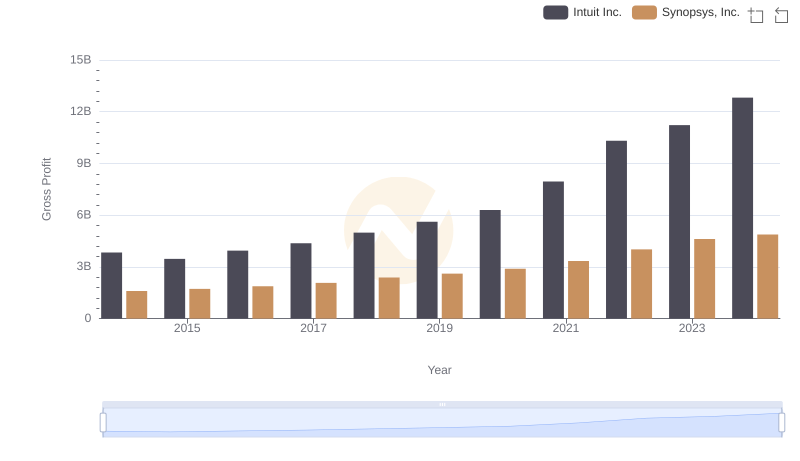
Intuit Inc. and Synopsys, Inc.: A Detailed Gross Profit Analysis
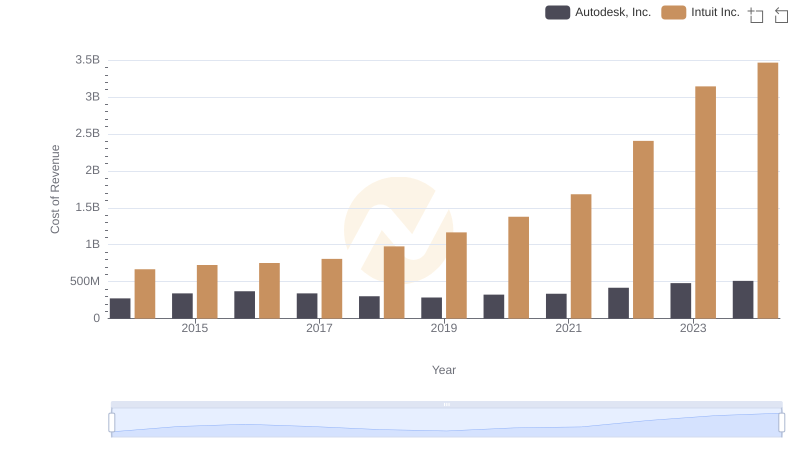
Cost of Revenue: Key Insights for Intuit Inc. and Autodesk, Inc.
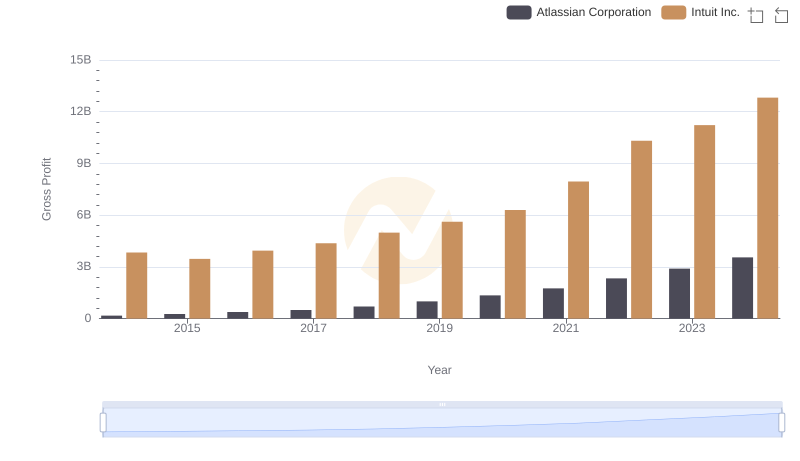
Gross Profit Analysis: Comparing Intuit Inc. and Atlassian Corporation
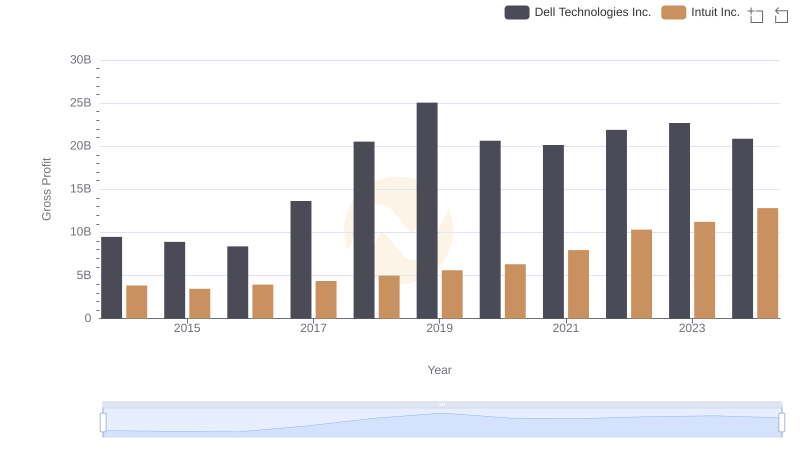
Intuit Inc. and Dell Technologies Inc.: A Detailed Gross Profit Analysis
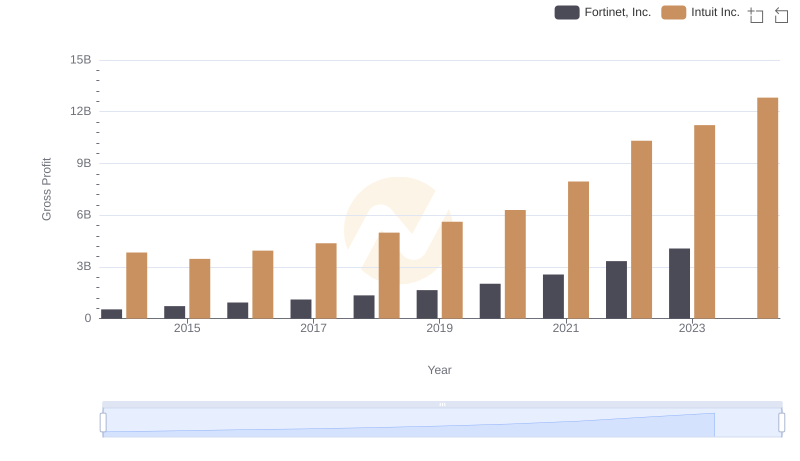
Intuit Inc. vs Fortinet, Inc.: A Gross Profit Performance Breakdown
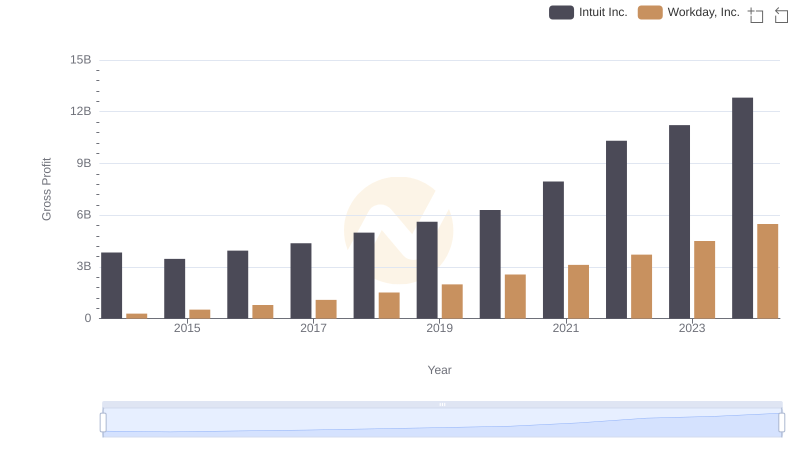
Gross Profit Comparison: Intuit Inc. and Workday, Inc. Trends
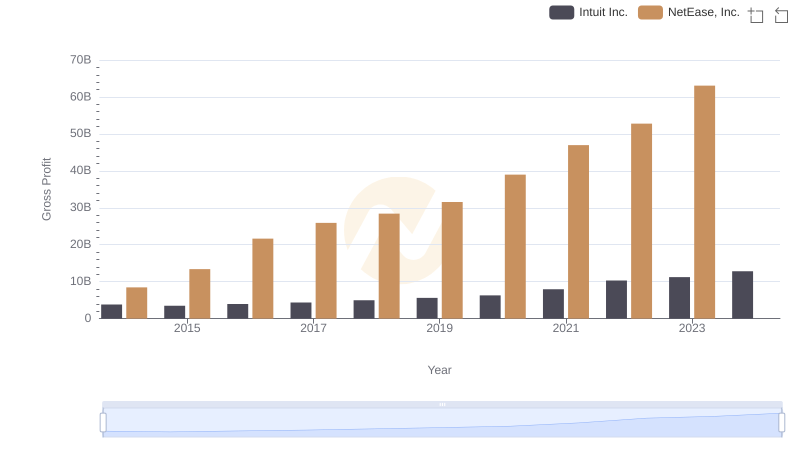
Who Generates Higher Gross Profit? Intuit Inc. or NetEase, Inc.
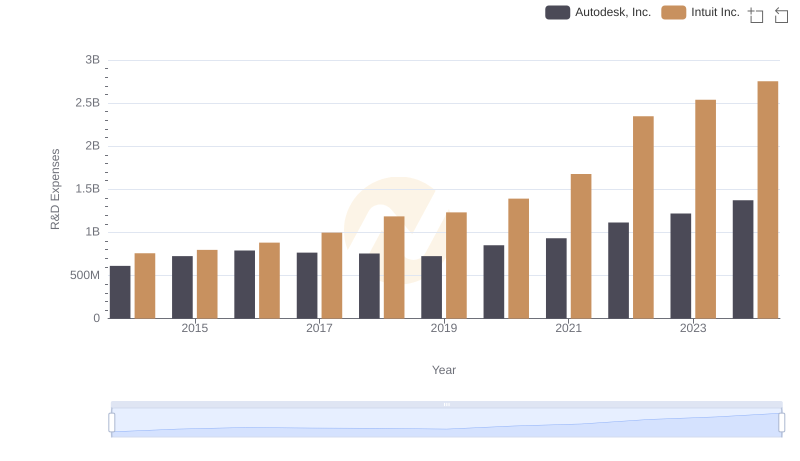
Research and Development Investment: Intuit Inc. vs Autodesk, Inc.
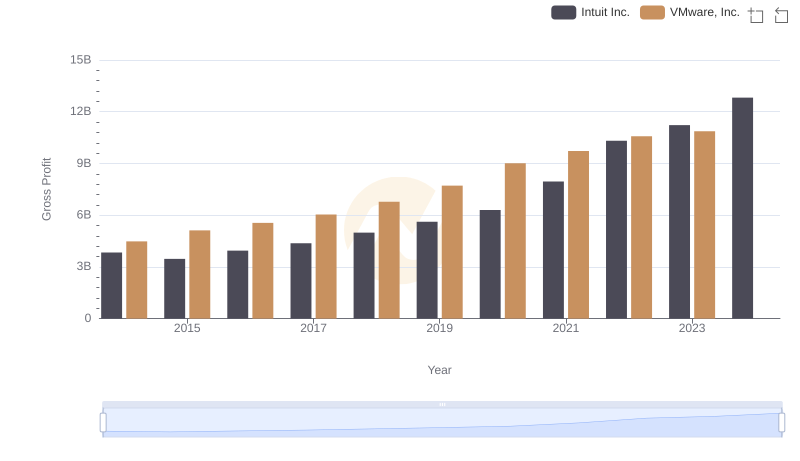
Intuit Inc. and VMware, Inc.: A Detailed Gross Profit Analysis
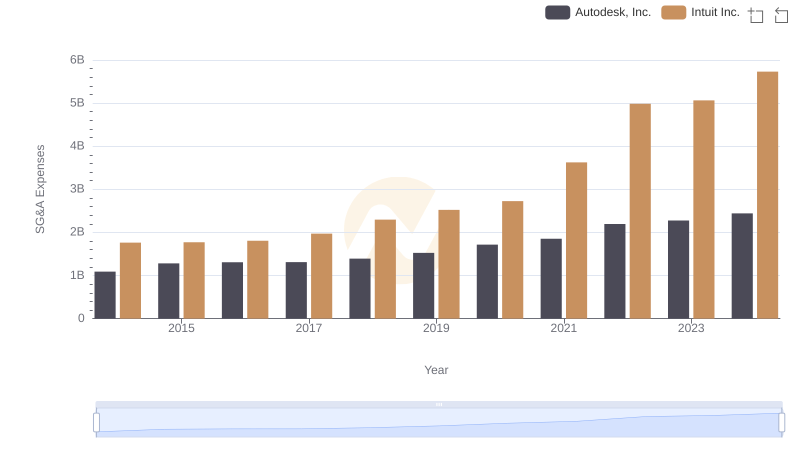
Intuit Inc. vs Autodesk, Inc.: SG&A Expense Trends