| __timestamp | Intuit Inc. | Workday, Inc. |
|---|---|---|
| Wednesday, January 1, 2014 | 1762000000 | 263294000 |
| Thursday, January 1, 2015 | 1771000000 | 421891000 |
| Friday, January 1, 2016 | 1807000000 | 582634000 |
| Sunday, January 1, 2017 | 1973000000 | 781996000 |
| Monday, January 1, 2018 | 2298000000 | 906276000 |
| Tuesday, January 1, 2019 | 2524000000 | 1238682000 |
| Wednesday, January 1, 2020 | 2727000000 | 1514272000 |
| Friday, January 1, 2021 | 3626000000 | 1647241000 |
| Saturday, January 1, 2022 | 4986000000 | 1947933000 |
| Sunday, January 1, 2023 | 5062000000 | 2452180000 |
| Monday, January 1, 2024 | 5730000000 | 2841000000 |
Unleashing insights
In the ever-evolving landscape of financial technology, understanding the spending patterns of industry giants like Intuit Inc. and Workday, Inc. offers valuable insights. Over the past decade, Intuit has consistently outpaced Workday in Selling, General, and Administrative (SG&A) expenses, reflecting its expansive growth strategy. From 2014 to 2024, Intuit's SG&A expenses surged by over 225%, reaching approximately $5.73 billion in 2024. In contrast, Workday's SG&A expenses grew by nearly 980% during the same period, peaking at around $2.84 billion.
This trend highlights Intuit's dominant market position and its aggressive investment in administrative capabilities. Meanwhile, Workday's rapid increase in SG&A spending underscores its ambitious expansion efforts in the competitive cloud-based software sector. As these companies continue to innovate, their spending patterns provide a window into their strategic priorities and market positioning.
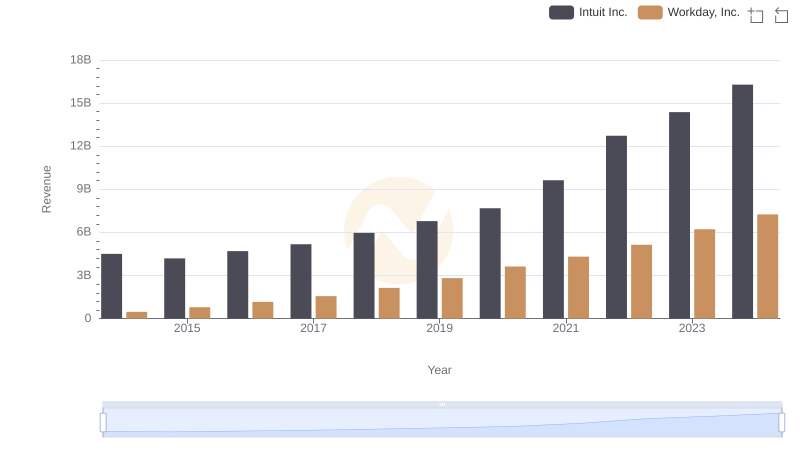
Intuit Inc. vs Workday, Inc.: Annual Revenue Growth Compared
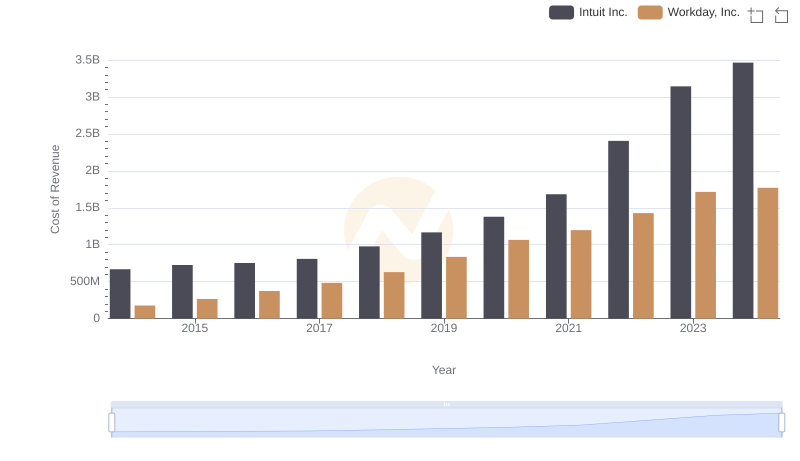
Comparing Cost of Revenue Efficiency: Intuit Inc. vs Workday, Inc.
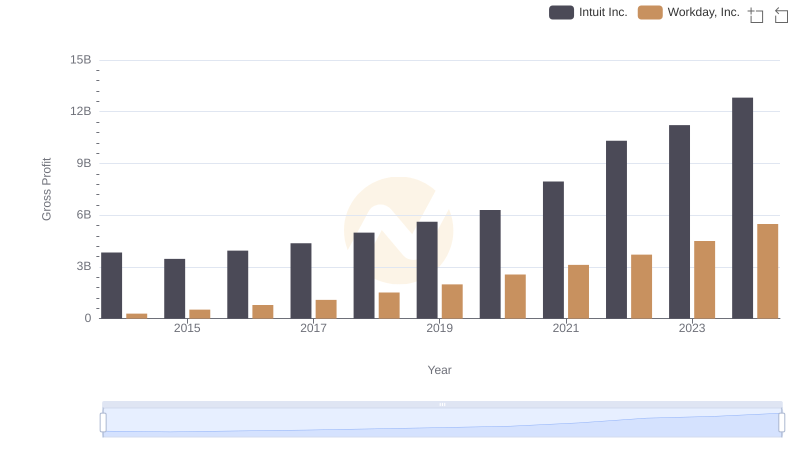
Gross Profit Comparison: Intuit Inc. and Workday, Inc. Trends
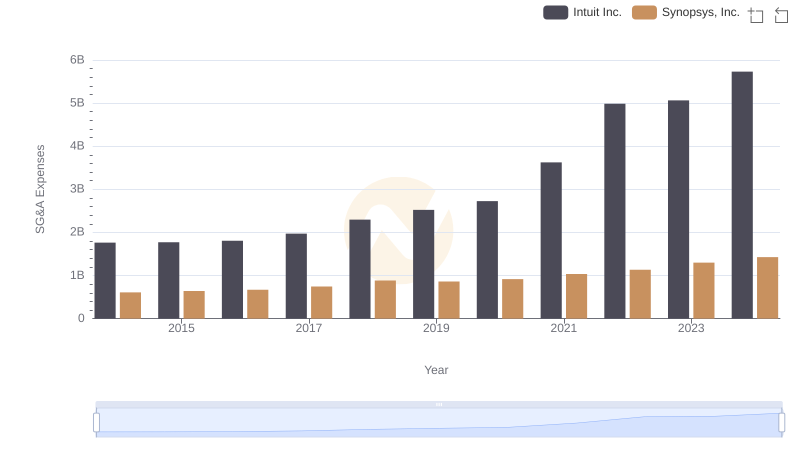
Who Optimizes SG&A Costs Better? Intuit Inc. or Synopsys, Inc.
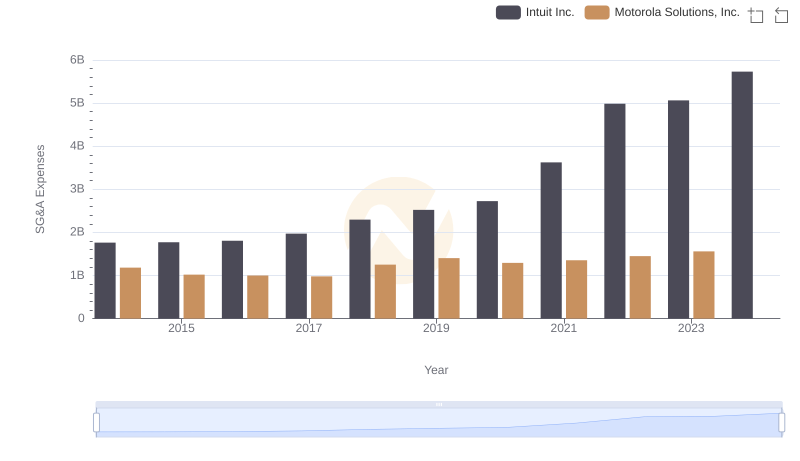
Selling, General, and Administrative Costs: Intuit Inc. vs Motorola Solutions, Inc.
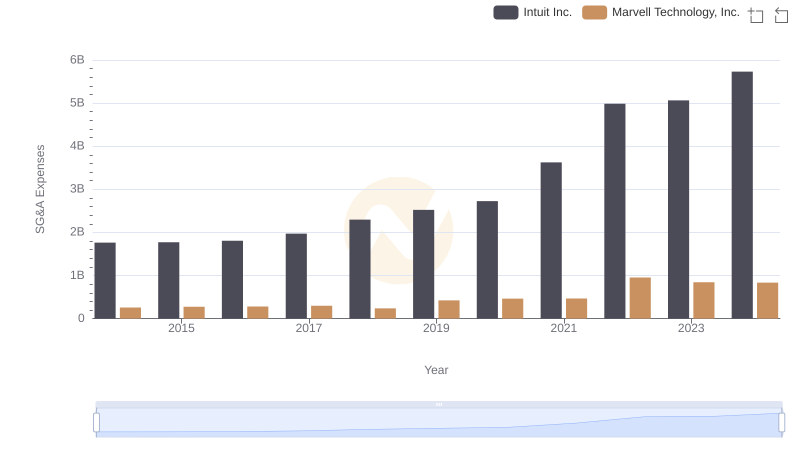
Operational Costs Compared: SG&A Analysis of Intuit Inc. and Marvell Technology, Inc.
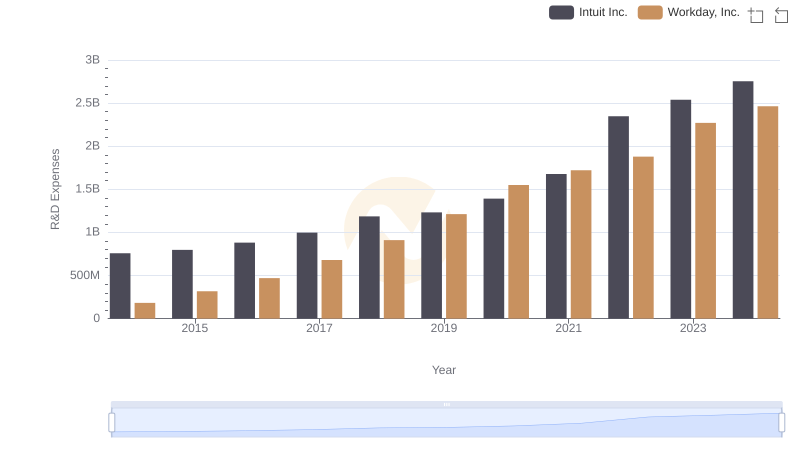
Research and Development Expenses Breakdown: Intuit Inc. vs Workday, Inc.
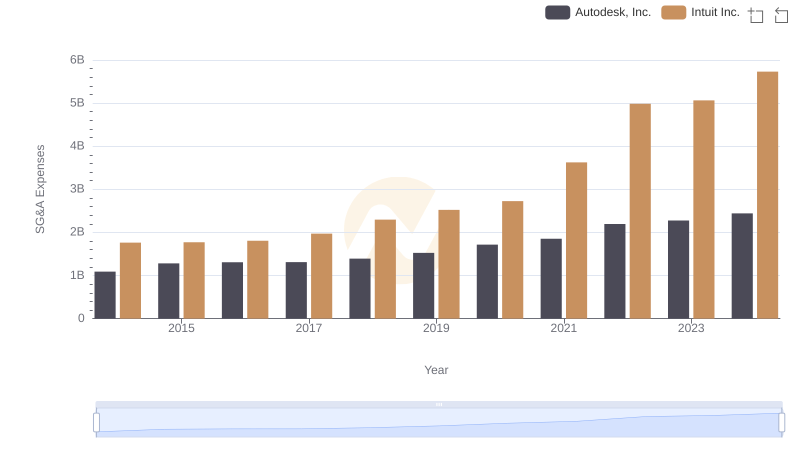
Intuit Inc. vs Autodesk, Inc.: SG&A Expense Trends
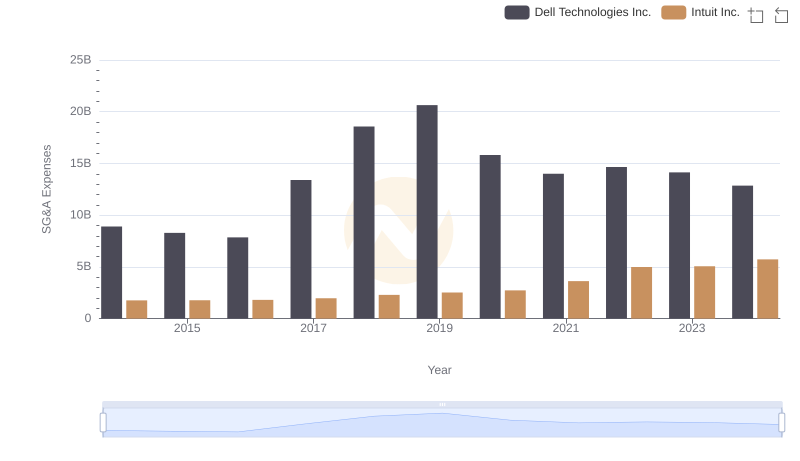
Operational Costs Compared: SG&A Analysis of Intuit Inc. and Dell Technologies Inc.
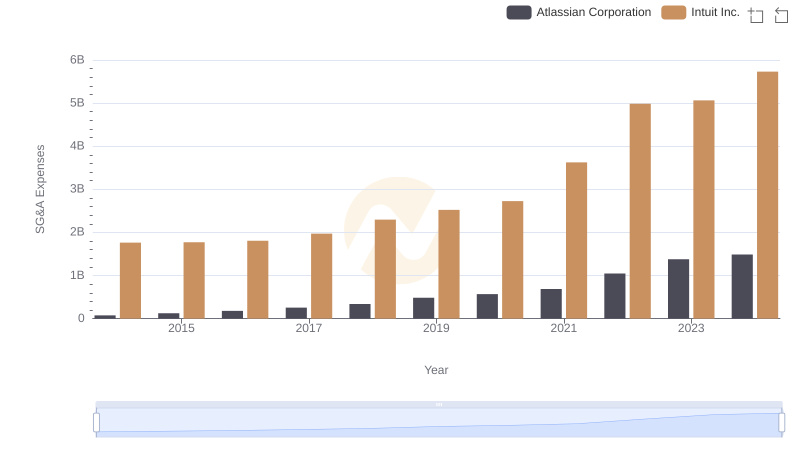
Who Optimizes SG&A Costs Better? Intuit Inc. or Atlassian Corporation
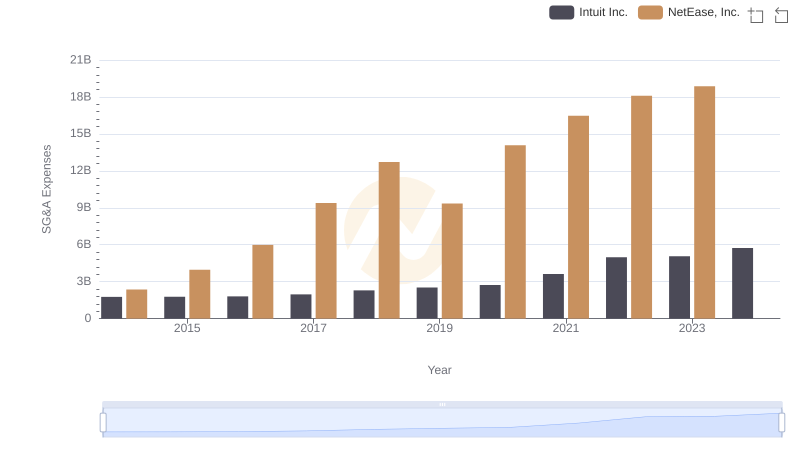
Breaking Down SG&A Expenses: Intuit Inc. vs NetEase, Inc.
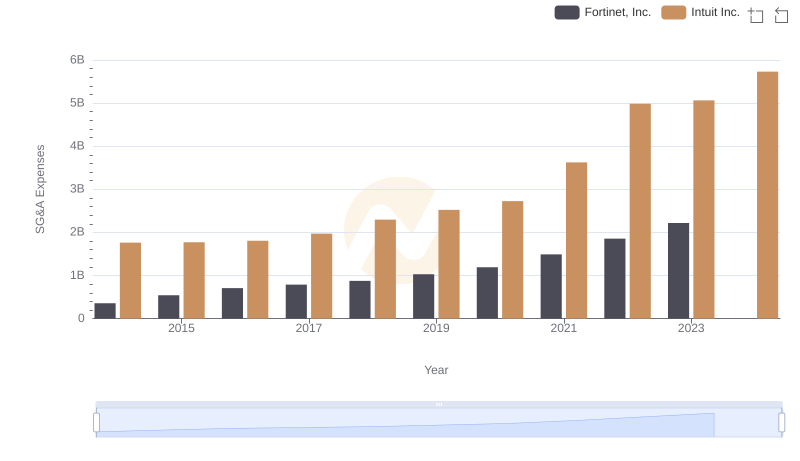
SG&A Efficiency Analysis: Comparing Intuit Inc. and Fortinet, Inc.