| __timestamp | Intuit Inc. | VeriSign, Inc. |
|---|---|---|
| Wednesday, January 1, 2014 | 1528000000 | 632995000 |
| Thursday, January 1, 2015 | 970000000 | 656772000 |
| Friday, January 1, 2016 | 1480000000 | 754904000 |
| Sunday, January 1, 2017 | 1634000000 | 785226000 |
| Monday, January 1, 2018 | 1839000000 | 892728000 |
| Tuesday, January 1, 2019 | 2121000000 | 895717000 |
| Wednesday, January 1, 2020 | 2430000000 | 886740000 |
| Friday, January 1, 2021 | 2948000000 | 913414000 |
| Saturday, January 1, 2022 | 3369000000 | 1002400000 |
| Sunday, January 1, 2023 | 4043000000 | 1095900000 |
| Monday, January 1, 2024 | 4581000000 | 1134100000 |
In pursuit of knowledge
In the ever-evolving landscape of technology, financial performance is a key indicator of a company's resilience and growth. This chart provides a decade-long comparison of EBITDA for Intuit Inc. and VeriSign, Inc., two giants in the tech industry. From 2014 to 2023, Intuit Inc. has shown a remarkable growth trajectory, with its EBITDA increasing by approximately 200%, from $1.5 billion to over $4 billion. In contrast, VeriSign, Inc. has experienced a steadier growth, with its EBITDA rising by about 73% over the same period, reaching just over $1 billion in 2023. Notably, the data for 2024 is incomplete for VeriSign, highlighting the need for cautious interpretation. This comparison underscores Intuit's aggressive expansion and strategic investments, while VeriSign maintains a consistent, albeit slower, growth path. Such insights are invaluable for investors and industry analysts alike.
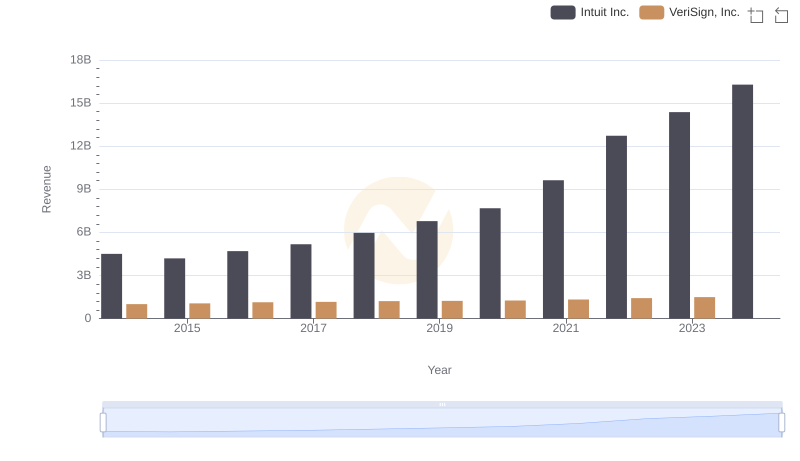
Who Generates More Revenue? Intuit Inc. or VeriSign, Inc.
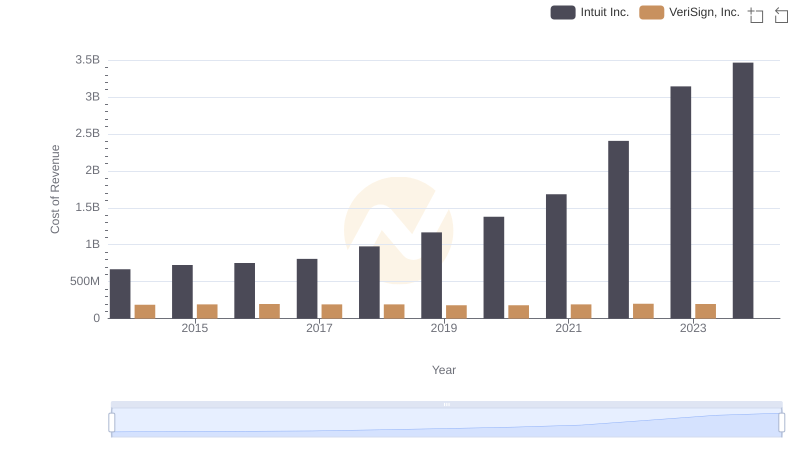
Comparing Cost of Revenue Efficiency: Intuit Inc. vs VeriSign, Inc.
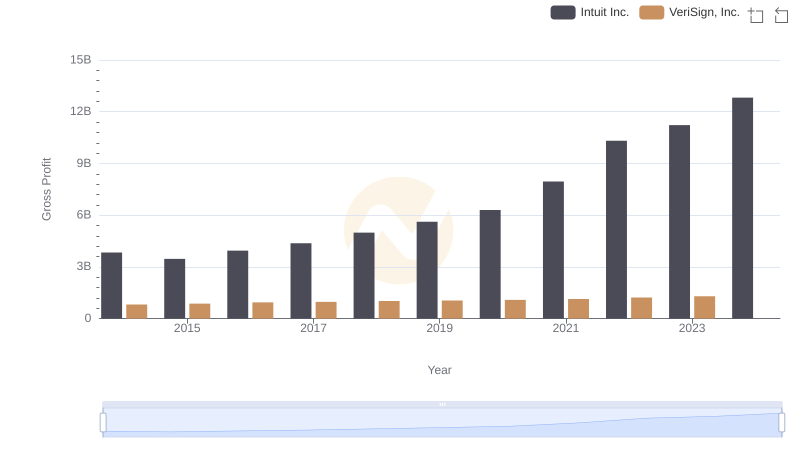
Gross Profit Comparison: Intuit Inc. and VeriSign, Inc. Trends
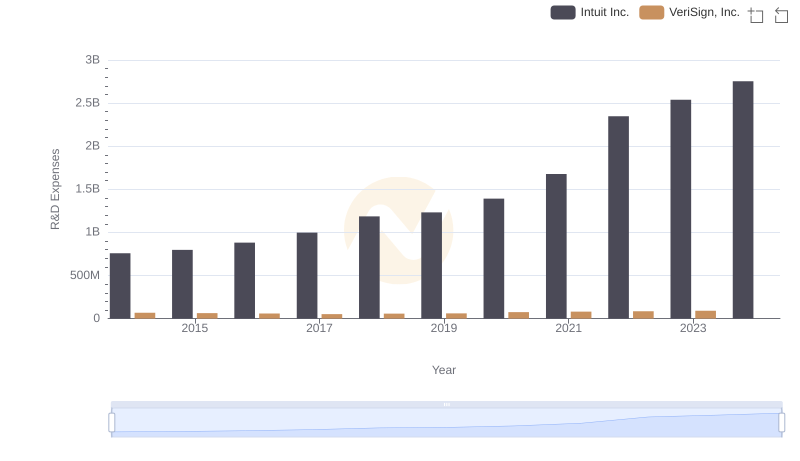
R&D Spending Showdown: Intuit Inc. vs VeriSign, Inc.
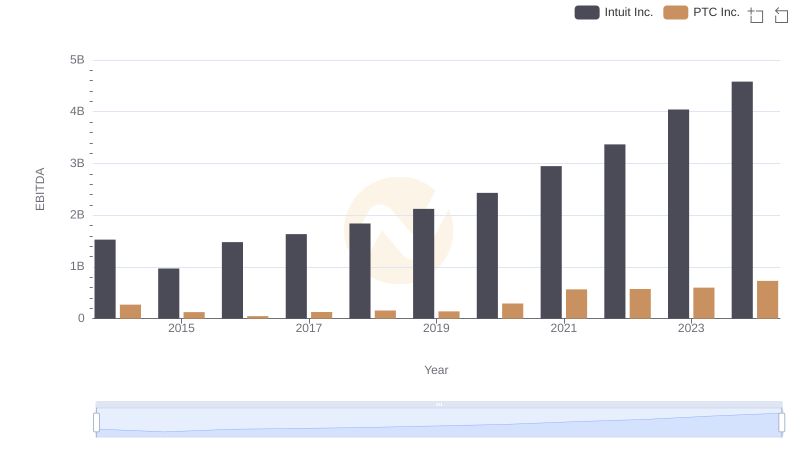
Intuit Inc. vs PTC Inc.: In-Depth EBITDA Performance Comparison
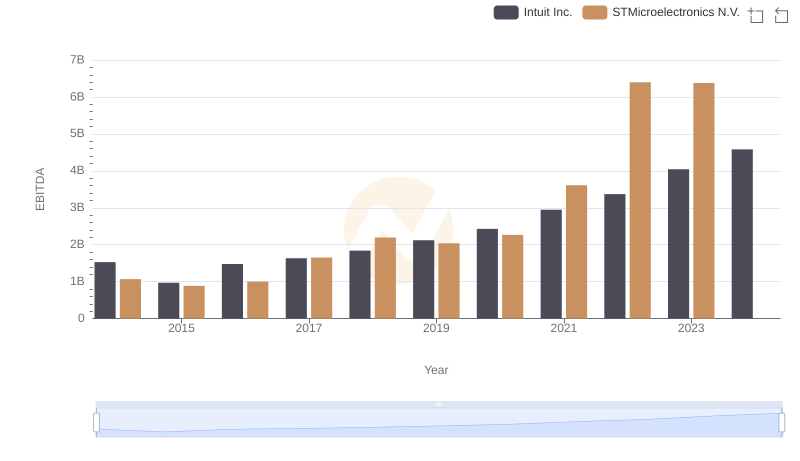
EBITDA Analysis: Evaluating Intuit Inc. Against STMicroelectronics N.V.
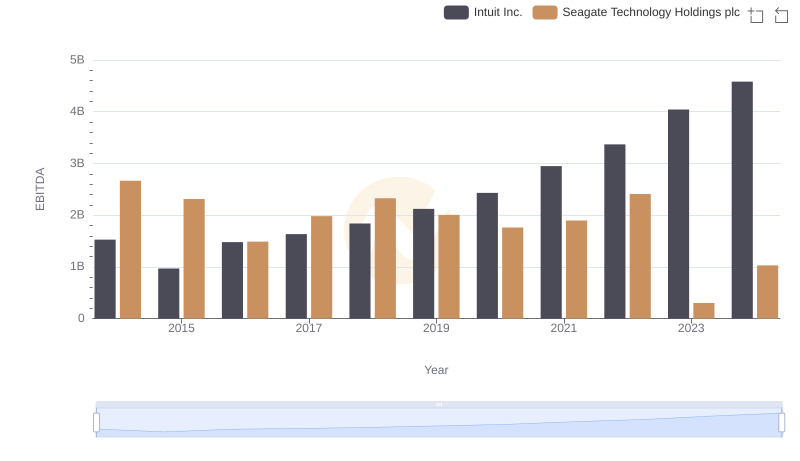
Intuit Inc. vs Seagate Technology Holdings plc: In-Depth EBITDA Performance Comparison
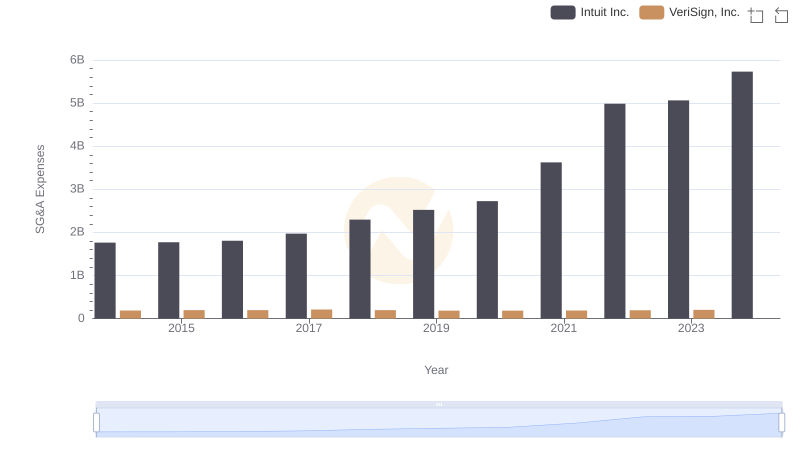
Intuit Inc. vs VeriSign, Inc.: SG&A Expense Trends
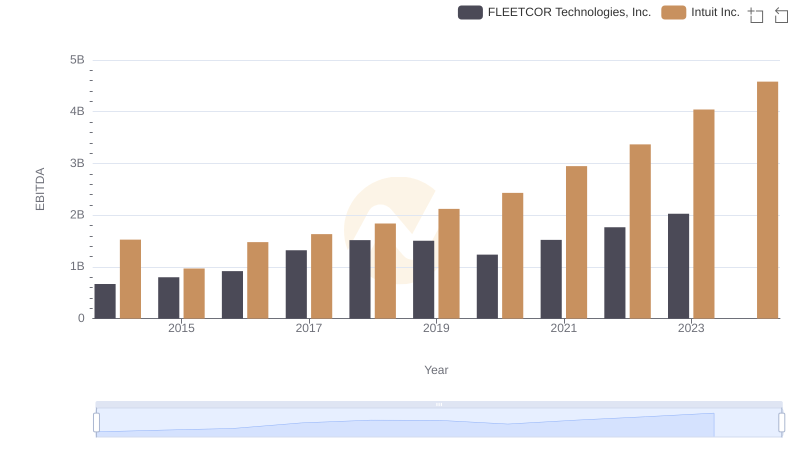
Professional EBITDA Benchmarking: Intuit Inc. vs FLEETCOR Technologies, Inc.
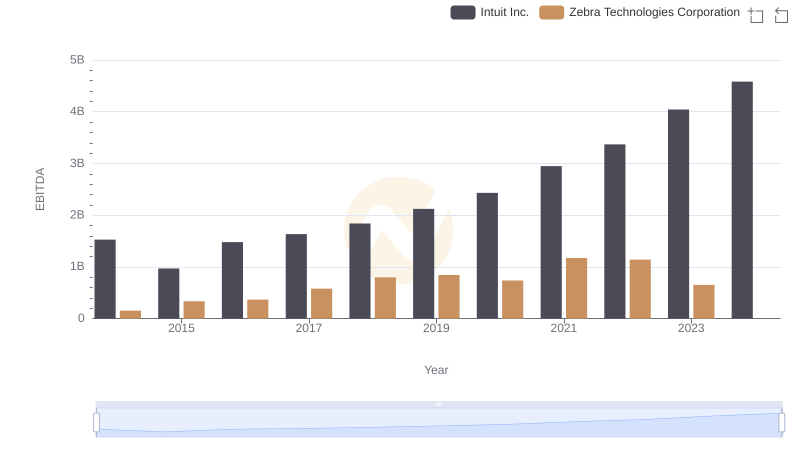
EBITDA Analysis: Evaluating Intuit Inc. Against Zebra Technologies Corporation
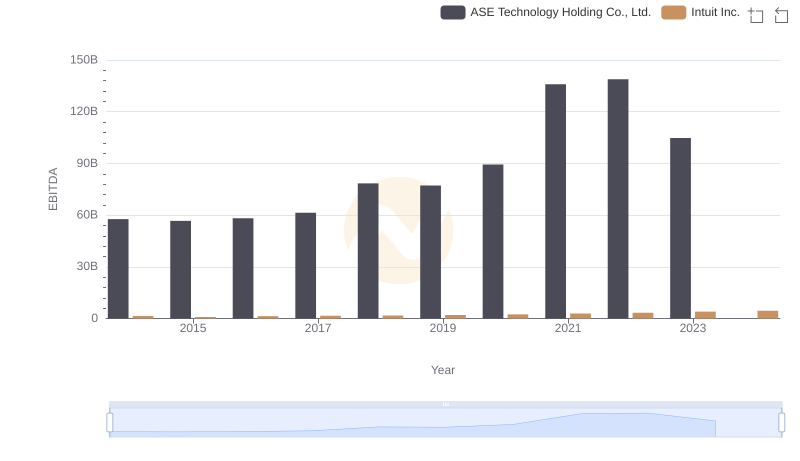
EBITDA Metrics Evaluated: Intuit Inc. vs ASE Technology Holding Co., Ltd.
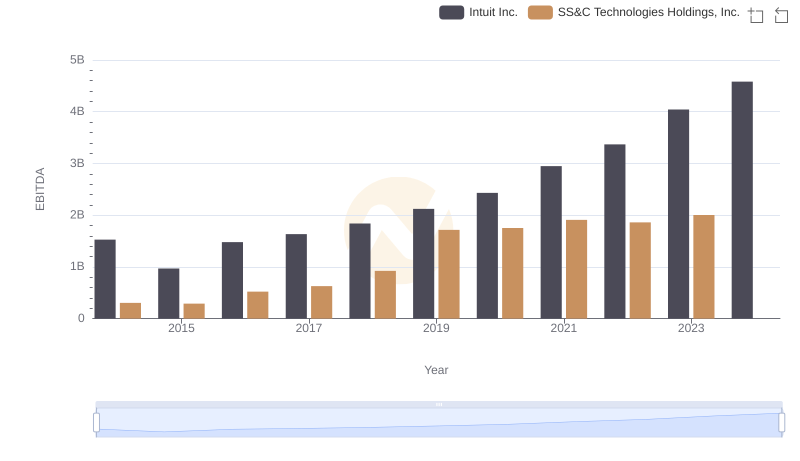
EBITDA Performance Review: Intuit Inc. vs SS&C Technologies Holdings, Inc.