| __timestamp | Intuit Inc. | VeriSign, Inc. |
|---|---|---|
| Wednesday, January 1, 2014 | 1762000000 | 189488000 |
| Thursday, January 1, 2015 | 1771000000 | 196914000 |
| Friday, January 1, 2016 | 1807000000 | 198253000 |
| Sunday, January 1, 2017 | 1973000000 | 211705000 |
| Monday, January 1, 2018 | 2298000000 | 197559000 |
| Tuesday, January 1, 2019 | 2524000000 | 184262000 |
| Wednesday, January 1, 2020 | 2727000000 | 186003000 |
| Friday, January 1, 2021 | 3626000000 | 188311000 |
| Saturday, January 1, 2022 | 4986000000 | 195400000 |
| Sunday, January 1, 2023 | 5062000000 | 204200000 |
| Monday, January 1, 2024 | 5730000000 | 211100000 |
Igniting the spark of knowledge
In the ever-evolving landscape of technology, understanding financial trends is crucial. Over the past decade, Intuit Inc. and VeriSign, Inc. have shown contrasting trajectories in their Selling, General, and Administrative (SG&A) expenses. Intuit's SG&A expenses have surged by over 225% from 2014 to 2023, reflecting its aggressive growth strategy and market expansion. In contrast, VeriSign's expenses have remained relatively stable, with a modest increase of about 8% over the same period, indicating a more conservative financial approach.
The data reveals that Intuit's expenses peaked in 2024, while VeriSign's data for the same year is missing, leaving room for speculation. This divergence highlights the different operational strategies of these tech giants. As Intuit continues to invest heavily in its operations, VeriSign maintains a steady course, focusing on efficiency and stability.
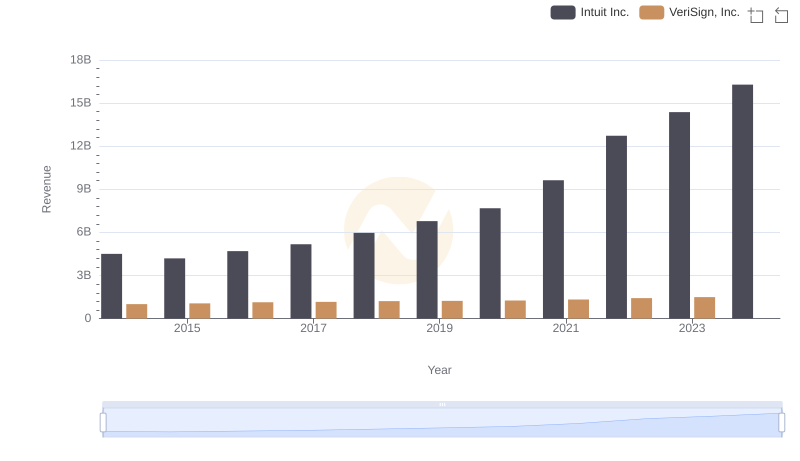
Who Generates More Revenue? Intuit Inc. or VeriSign, Inc.
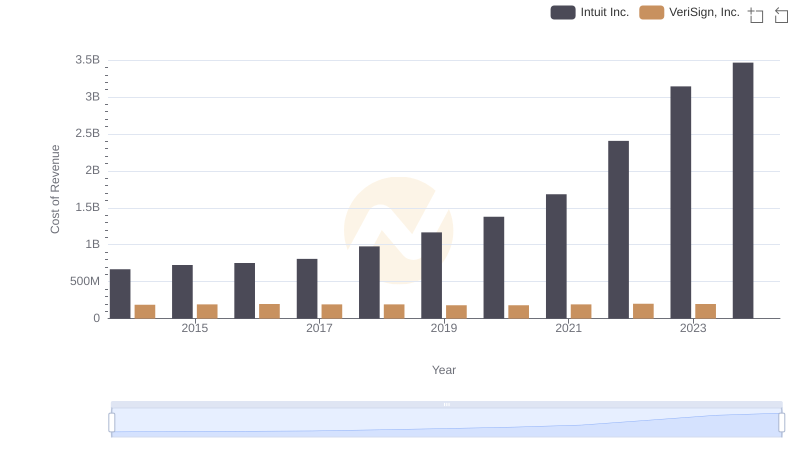
Comparing Cost of Revenue Efficiency: Intuit Inc. vs VeriSign, Inc.
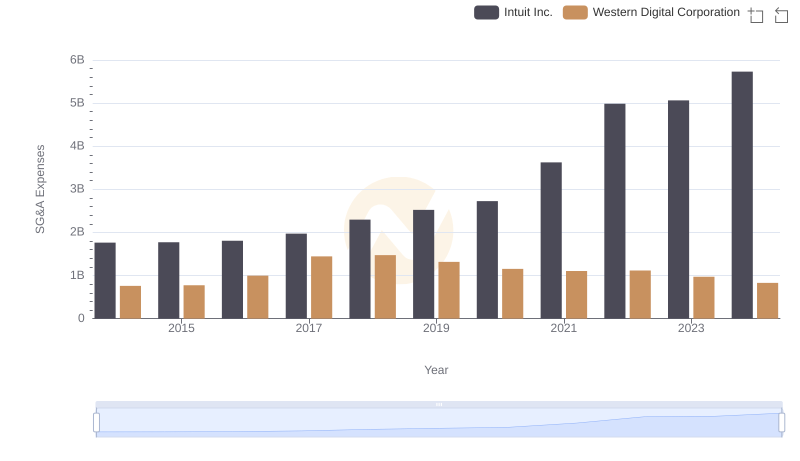
Intuit Inc. or Western Digital Corporation: Who Manages SG&A Costs Better?
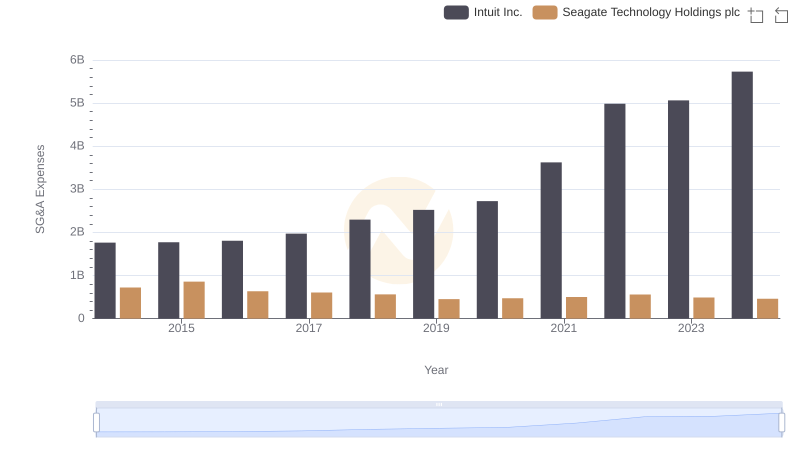
Cost Management Insights: SG&A Expenses for Intuit Inc. and Seagate Technology Holdings plc
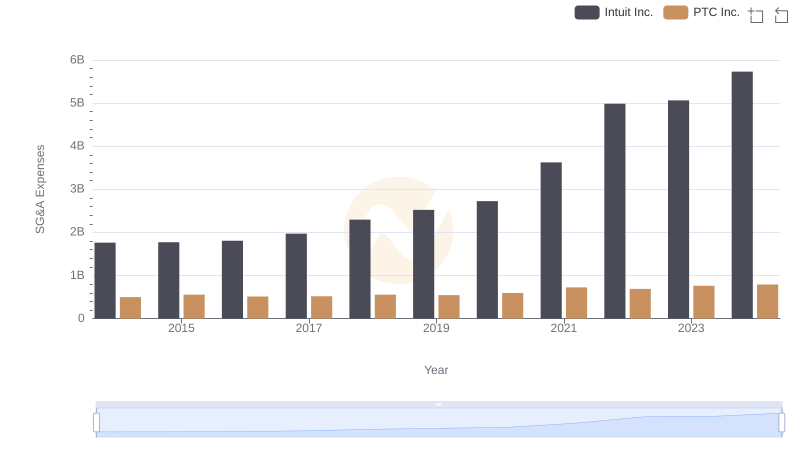
Selling, General, and Administrative Costs: Intuit Inc. vs PTC Inc.
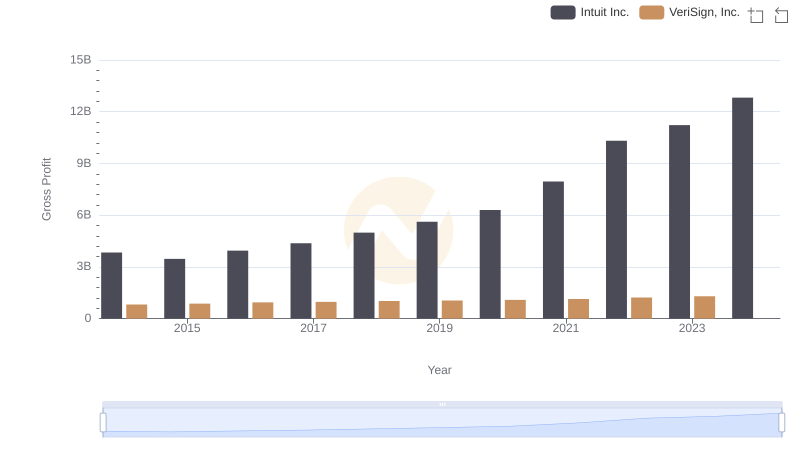
Gross Profit Comparison: Intuit Inc. and VeriSign, Inc. Trends
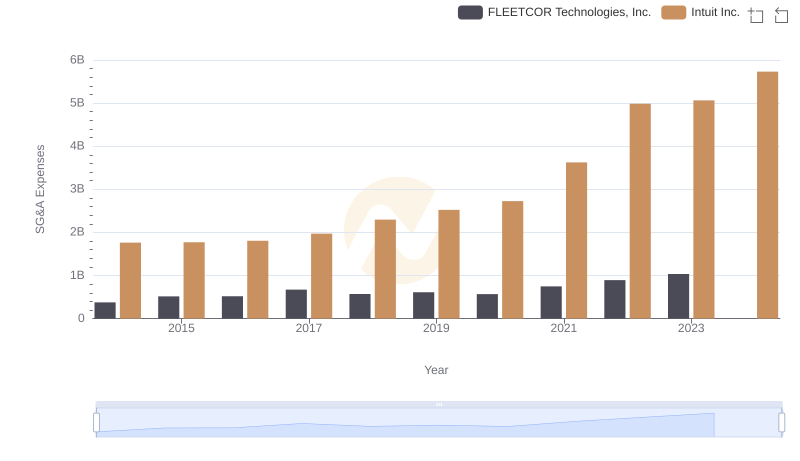
Comparing SG&A Expenses: Intuit Inc. vs FLEETCOR Technologies, Inc. Trends and Insights
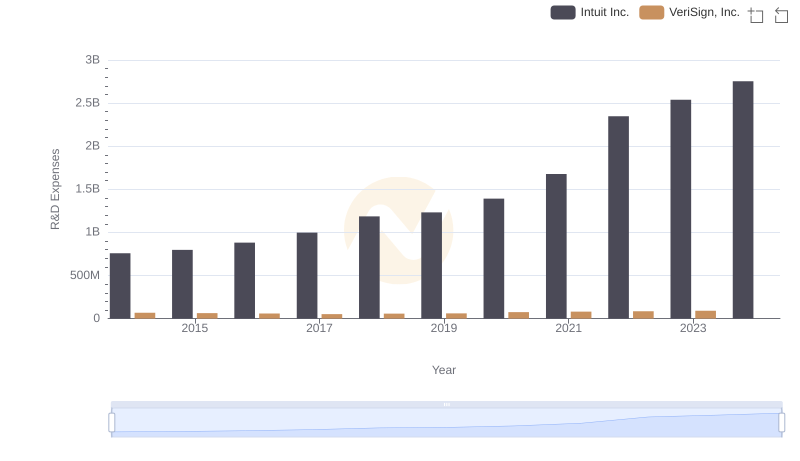
R&D Spending Showdown: Intuit Inc. vs VeriSign, Inc.

Operational Costs Compared: SG&A Analysis of Intuit Inc. and Zebra Technologies Corporation
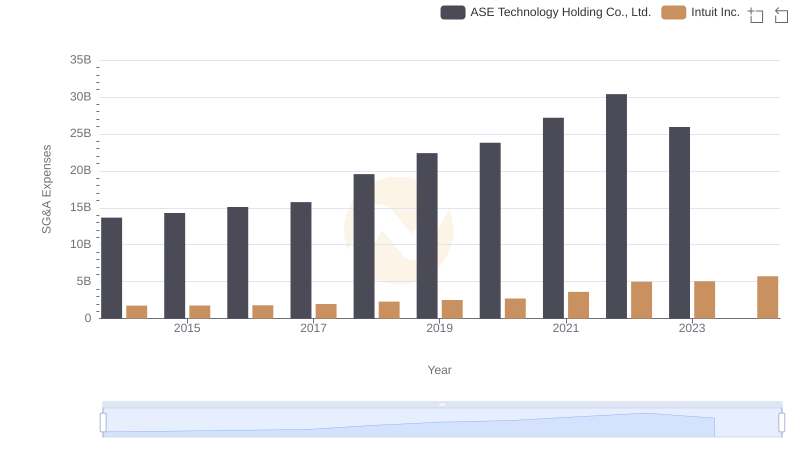
Cost Management Insights: SG&A Expenses for Intuit Inc. and ASE Technology Holding Co., Ltd.
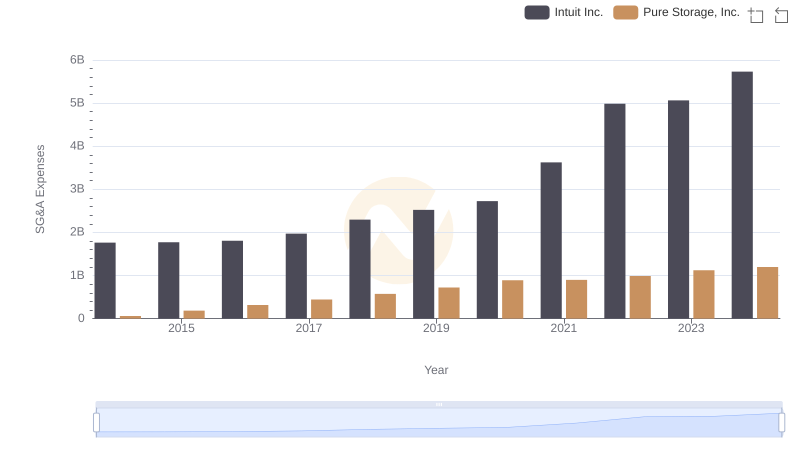
Comparing SG&A Expenses: Intuit Inc. vs Pure Storage, Inc. Trends and Insights
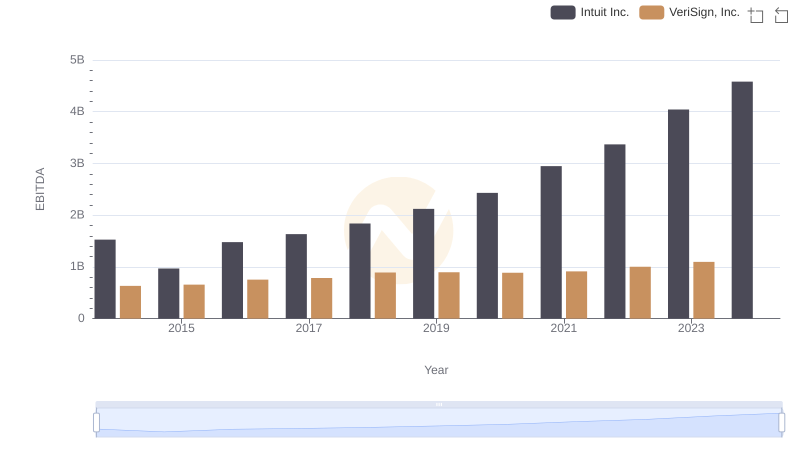
Professional EBITDA Benchmarking: Intuit Inc. vs VeriSign, Inc.