| __timestamp | Intuit Inc. | MicroStrategy Incorporated |
|---|---|---|
| Wednesday, January 1, 2014 | 668000000 | 135210000 |
| Thursday, January 1, 2015 | 725000000 | 101108000 |
| Friday, January 1, 2016 | 752000000 | 93147000 |
| Sunday, January 1, 2017 | 809000000 | 96649000 |
| Monday, January 1, 2018 | 977000000 | 99499000 |
| Tuesday, January 1, 2019 | 1167000000 | 99974000 |
| Wednesday, January 1, 2020 | 1378000000 | 91055000 |
| Friday, January 1, 2021 | 1683000000 | 91909000 |
| Saturday, January 1, 2022 | 2406000000 | 102989000 |
| Sunday, January 1, 2023 | 3143000000 | 109944000 |
| Monday, January 1, 2024 | 3465000000 | 129468000 |
Cracking the code
In the ever-evolving landscape of technology, understanding the cost dynamics of leading companies is crucial. This analysis delves into the cost of revenue trends for Intuit Inc. and MicroStrategy Incorporated from 2014 to 2023. Over this decade, Intuit's cost of revenue surged by over 400%, reflecting its aggressive growth and expansion strategies. In contrast, MicroStrategy's cost of revenue remained relatively stable, with a modest increase of about 20%.
Intuit's cost of revenue saw a significant rise, particularly from 2020 onwards, where it jumped from approximately $1.4 billion to $3.1 billion in 2023. This growth underscores Intuit's expanding market presence and investment in new technologies.
MicroStrategy's cost of revenue, on the other hand, hovered around the $100 million mark, indicating a more conservative approach. The data for 2024 is missing, suggesting potential changes or strategic shifts.
This comparative analysis highlights the contrasting strategies of these tech giants, offering insights into their financial trajectories.
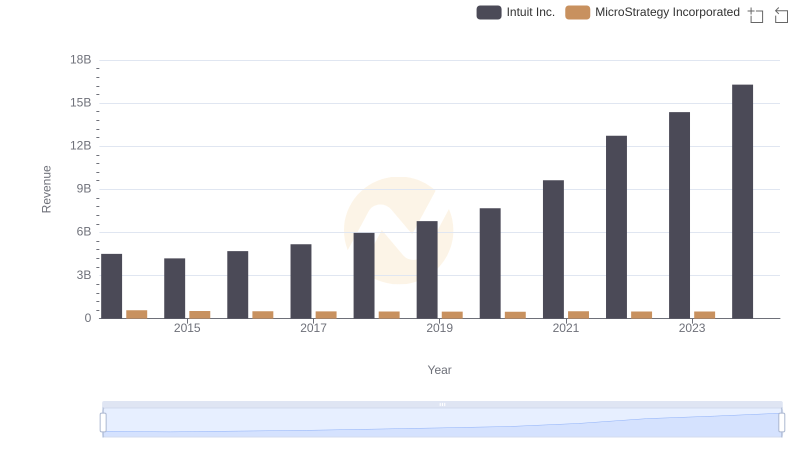
Revenue Showdown: Intuit Inc. vs MicroStrategy Incorporated
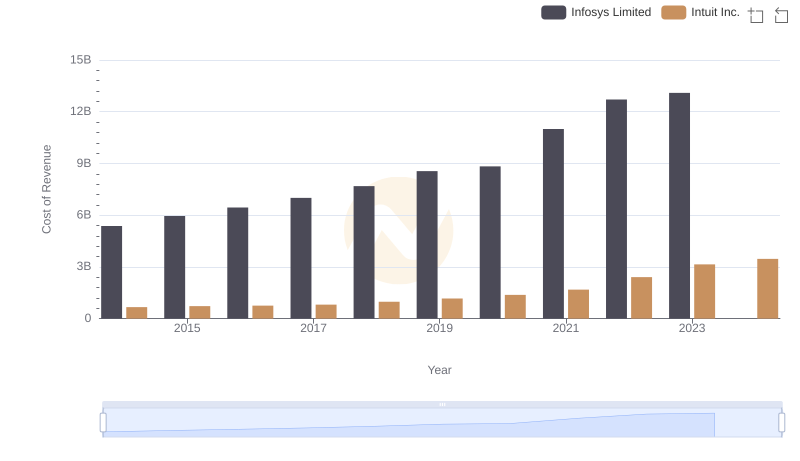
Comparing Cost of Revenue Efficiency: Intuit Inc. vs Infosys Limited
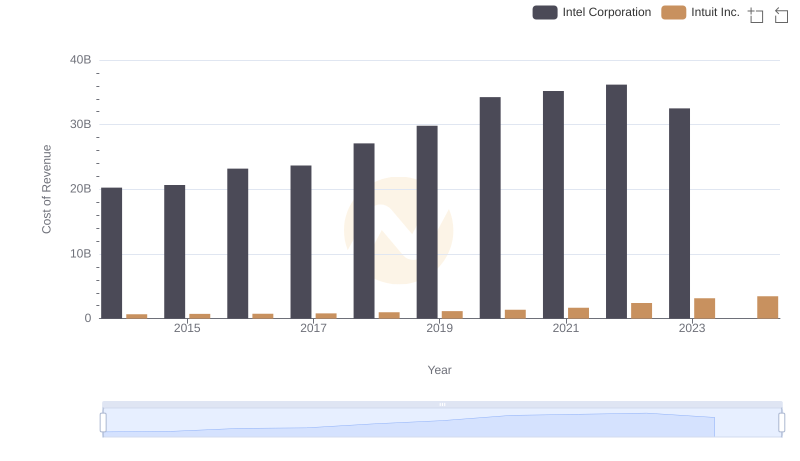
Intuit Inc. vs Intel Corporation: Efficiency in Cost of Revenue Explored
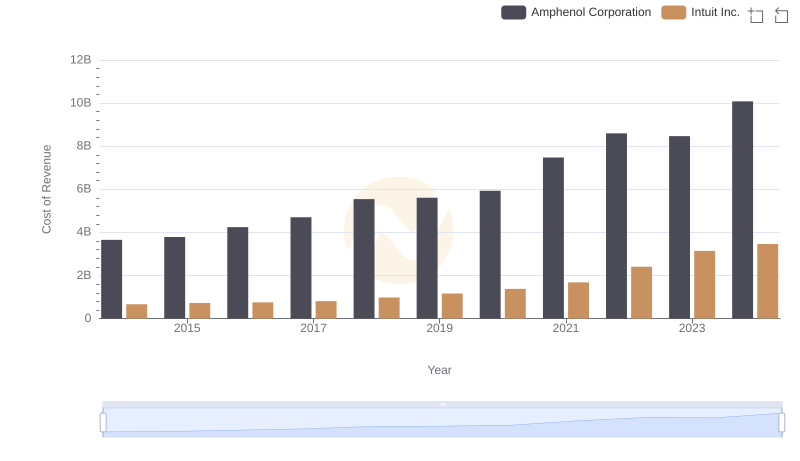
Analyzing Cost of Revenue: Intuit Inc. and Amphenol Corporation
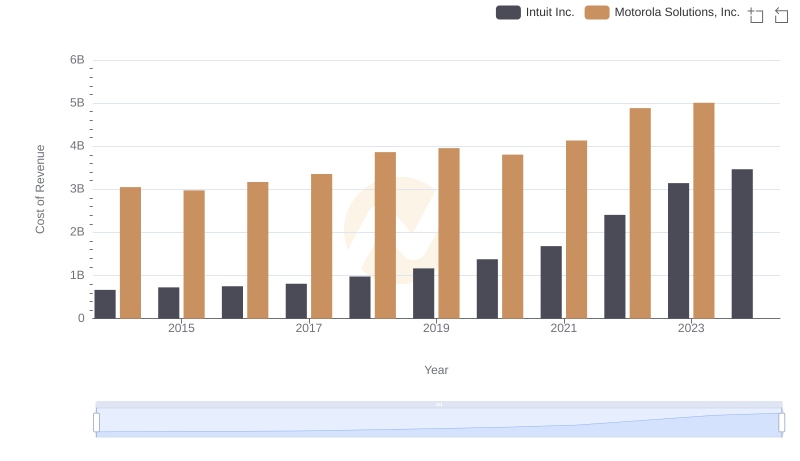
Cost Insights: Breaking Down Intuit Inc. and Motorola Solutions, Inc.'s Expenses
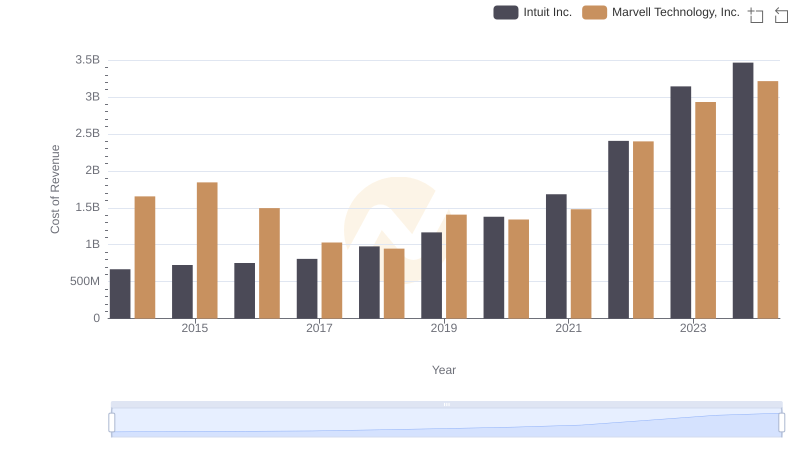
Cost of Revenue Comparison: Intuit Inc. vs Marvell Technology, Inc.
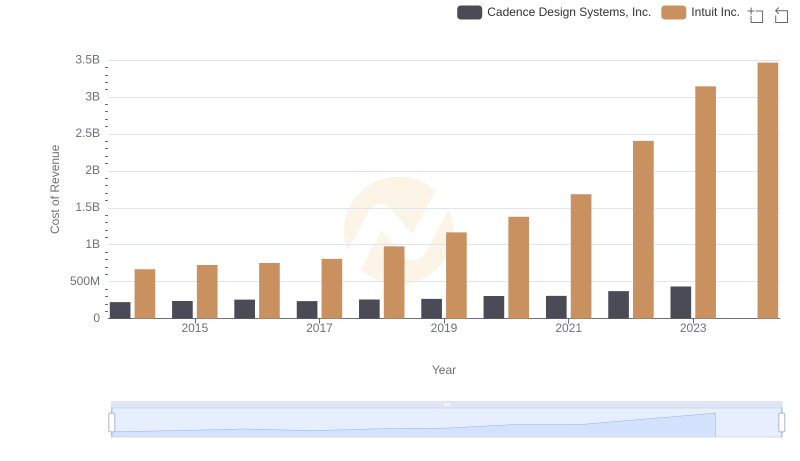
Cost of Revenue Trends: Intuit Inc. vs Cadence Design Systems, Inc.
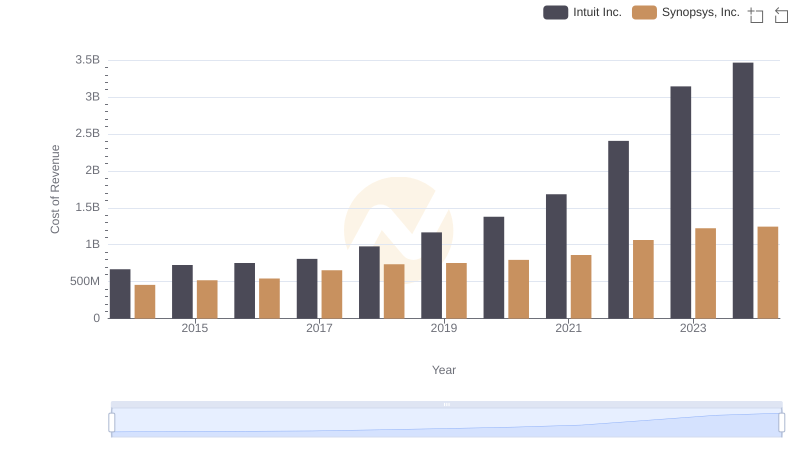
Comparing Cost of Revenue Efficiency: Intuit Inc. vs Synopsys, Inc.

Gross Profit Comparison: Intuit Inc. and MicroStrategy Incorporated Trends
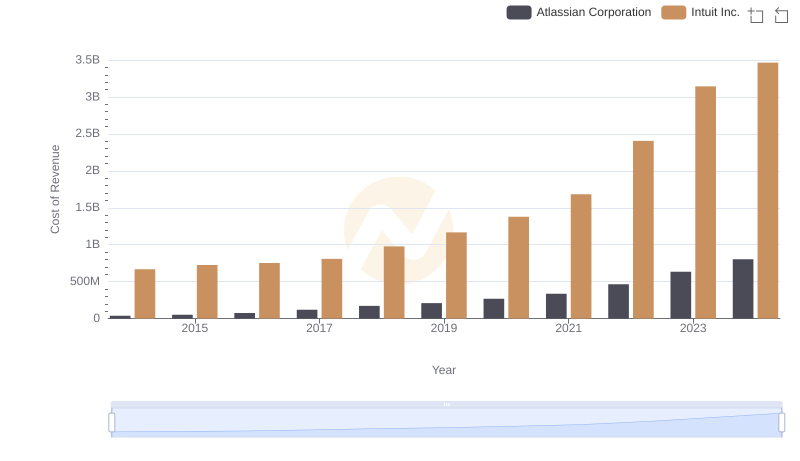
Analyzing Cost of Revenue: Intuit Inc. and Atlassian Corporation
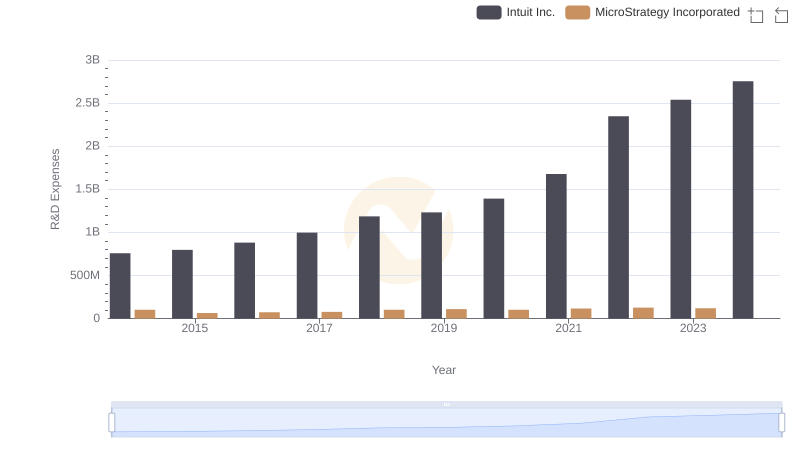
Intuit Inc. or MicroStrategy Incorporated: Who Invests More in Innovation?
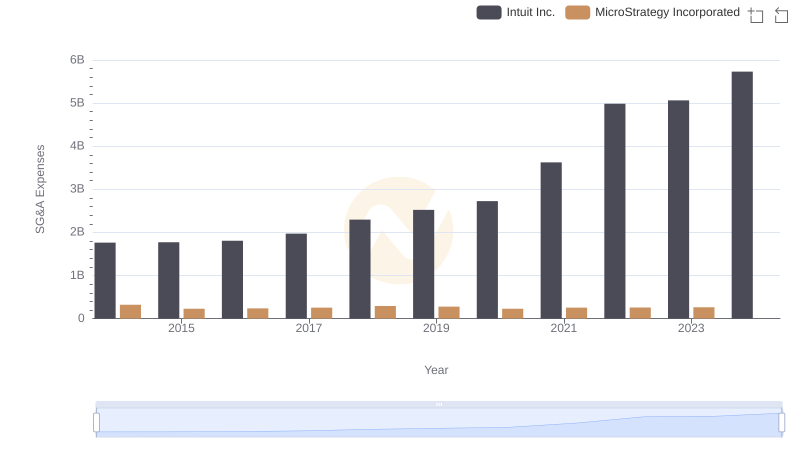
Intuit Inc. and MicroStrategy Incorporated: SG&A Spending Patterns Compared