| __timestamp | AECOM | Rockwell Automation, Inc. |
|---|---|---|
| Wednesday, January 1, 2014 | 4452451000 | 3869600000 |
| Thursday, January 1, 2015 | 17454692000 | 3604800000 |
| Friday, January 1, 2016 | 16768001000 | 3404000000 |
| Sunday, January 1, 2017 | 17519682000 | 3687100000 |
| Monday, January 1, 2018 | 19504863000 | 3793800000 |
| Tuesday, January 1, 2019 | 19359884000 | 3794700000 |
| Wednesday, January 1, 2020 | 12530416000 | 3734600000 |
| Friday, January 1, 2021 | 12542431000 | 4099700000 |
| Saturday, January 1, 2022 | 12300208000 | 4658400000 |
| Sunday, January 1, 2023 | 13432996000 | 5341000000 |
| Monday, January 1, 2024 | 15021157000 | 5070800000 |
Cracking the code
In the ever-evolving landscape of industrial giants, understanding cost dynamics is crucial. AECOM and Rockwell Automation, Inc., two stalwarts in their respective fields, have shown intriguing trends in their cost of revenue over the past decade. From 2014 to 2024, AECOM's cost of revenue has seen a significant fluctuation, peaking in 2018 with a 33% increase from 2014, before stabilizing around 2023. Meanwhile, Rockwell Automation, Inc. has experienced a steady rise, with a notable 38% increase from 2014 to 2023. This upward trajectory highlights Rockwell's strategic cost management and operational efficiency. As we look towards 2024, both companies are poised to navigate the challenges of cost management in an increasingly competitive market. These insights not only reflect their past performance but also set the stage for future financial strategies.
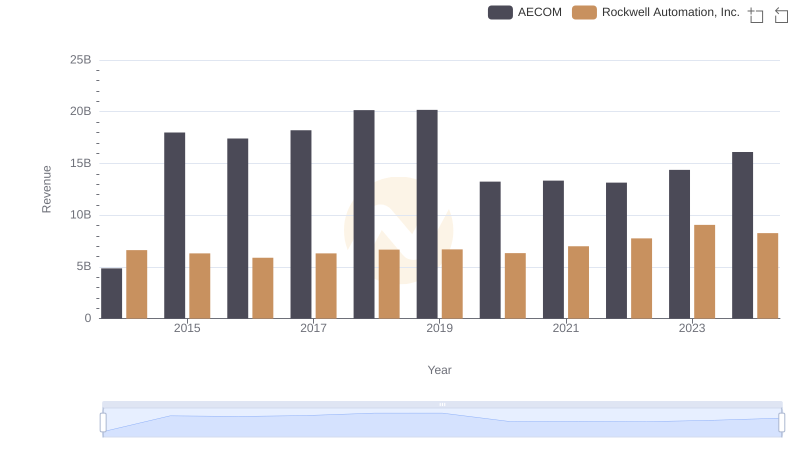
Breaking Down Revenue Trends: Rockwell Automation, Inc. vs AECOM
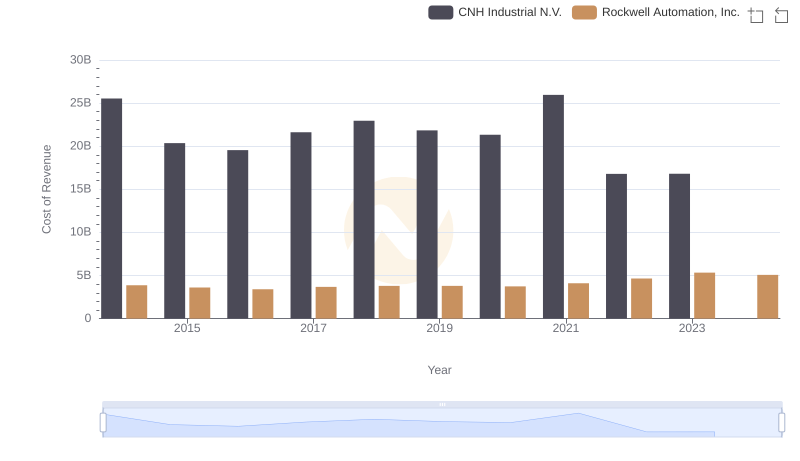
Comparing Cost of Revenue Efficiency: Rockwell Automation, Inc. vs CNH Industrial N.V.
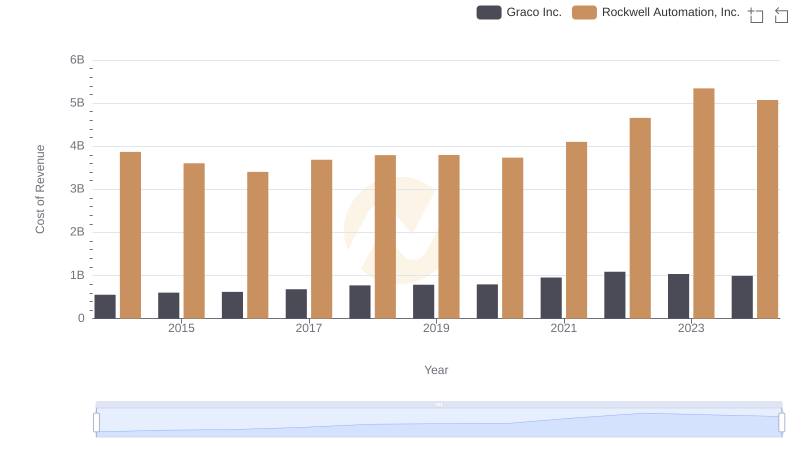
Cost Insights: Breaking Down Rockwell Automation, Inc. and Graco Inc.'s Expenses
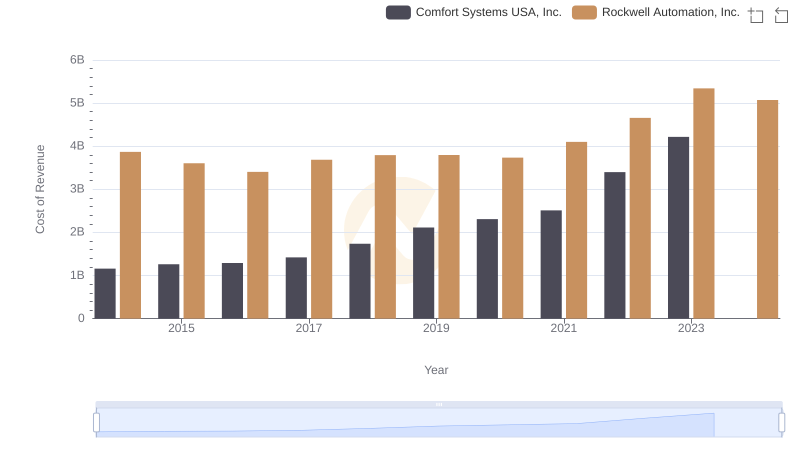
Cost of Revenue: Key Insights for Rockwell Automation, Inc. and Comfort Systems USA, Inc.
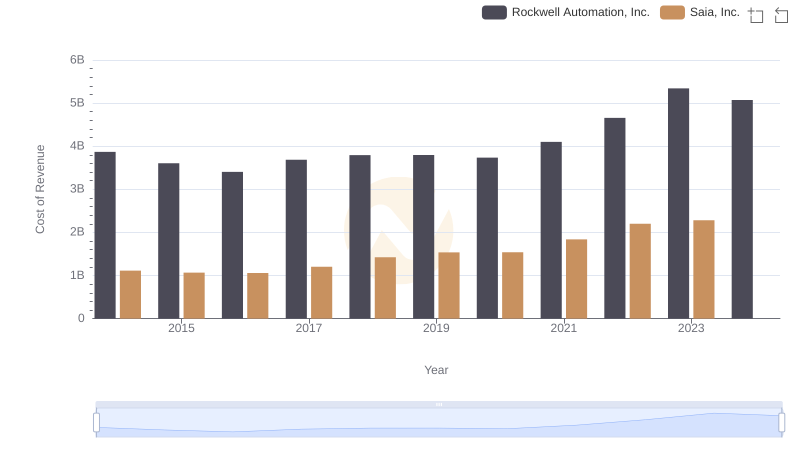
Cost of Revenue Comparison: Rockwell Automation, Inc. vs Saia, Inc.
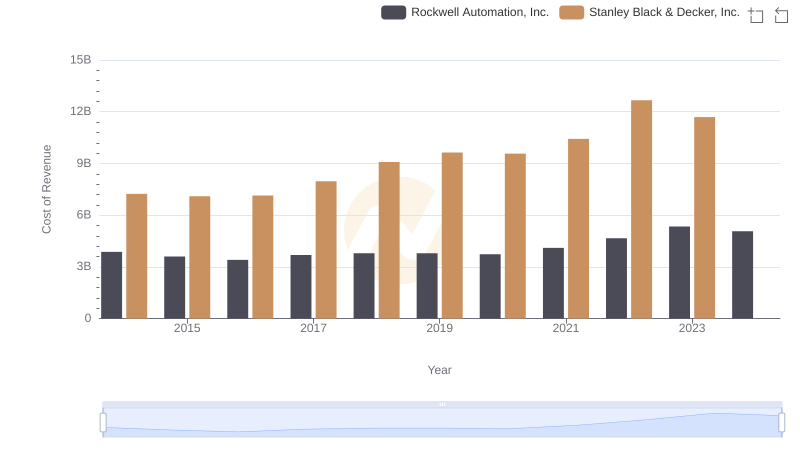
Rockwell Automation, Inc. vs Stanley Black & Decker, Inc.: Efficiency in Cost of Revenue Explored
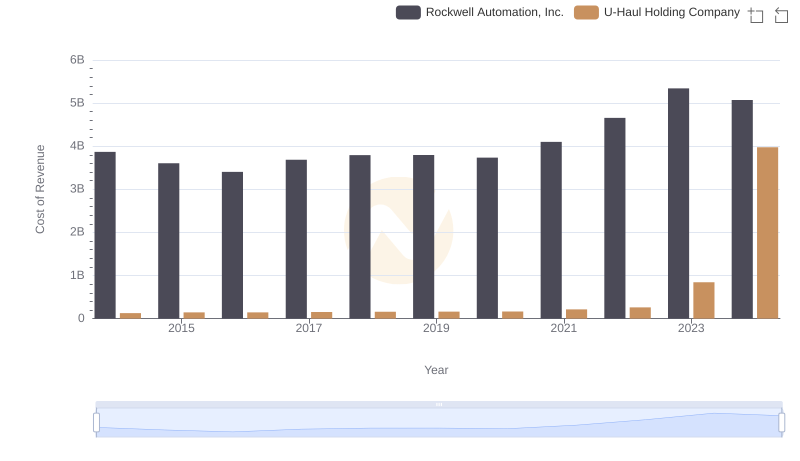
Analyzing Cost of Revenue: Rockwell Automation, Inc. and U-Haul Holding Company
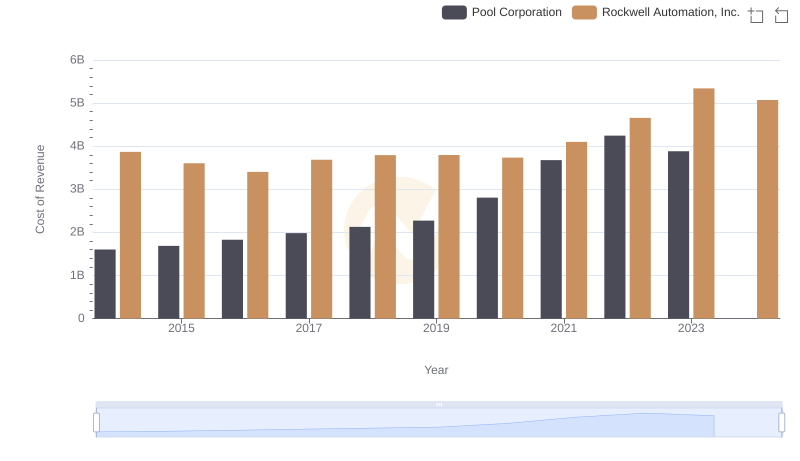
Analyzing Cost of Revenue: Rockwell Automation, Inc. and Pool Corporation
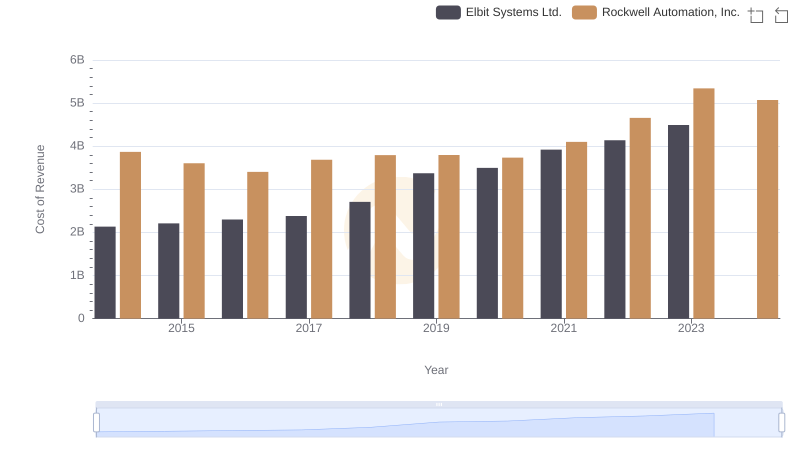
Cost Insights: Breaking Down Rockwell Automation, Inc. and Elbit Systems Ltd.'s Expenses
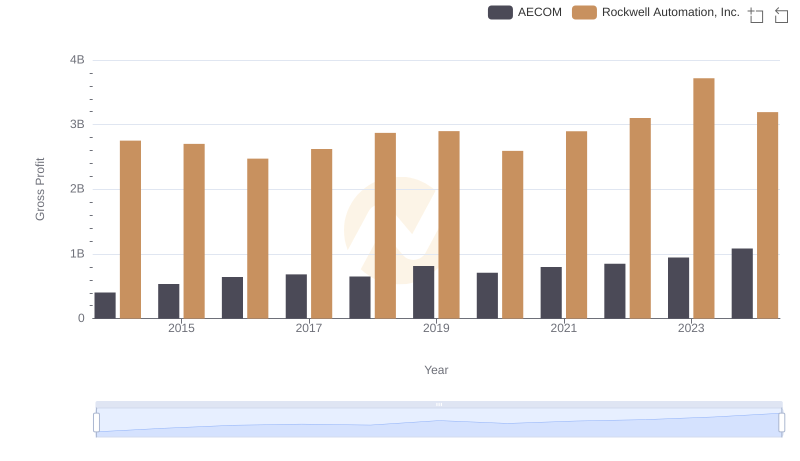
Gross Profit Analysis: Comparing Rockwell Automation, Inc. and AECOM
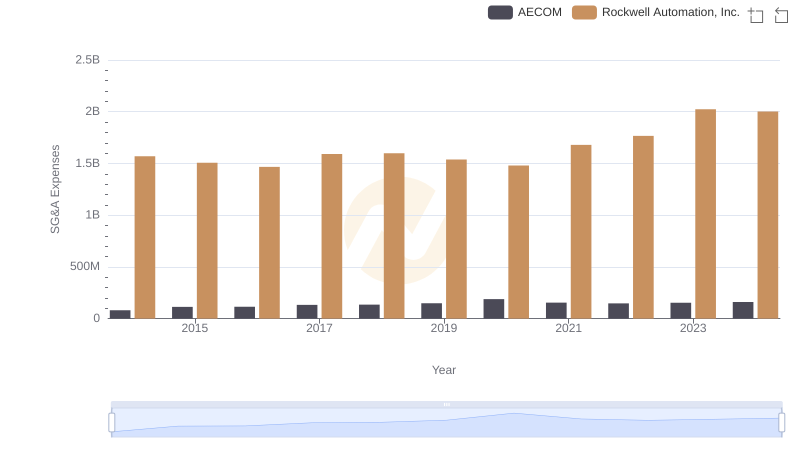
SG&A Efficiency Analysis: Comparing Rockwell Automation, Inc. and AECOM

Comparative EBITDA Analysis: Rockwell Automation, Inc. vs AECOM