| __timestamp | AECOM | Rockwell Automation, Inc. |
|---|---|---|
| Wednesday, January 1, 2014 | 80908000 | 1570100000 |
| Thursday, January 1, 2015 | 113975000 | 1506400000 |
| Friday, January 1, 2016 | 115088000 | 1467400000 |
| Sunday, January 1, 2017 | 133309000 | 1591500000 |
| Monday, January 1, 2018 | 135787000 | 1599000000 |
| Tuesday, January 1, 2019 | 148123000 | 1538500000 |
| Wednesday, January 1, 2020 | 188535000 | 1479800000 |
| Friday, January 1, 2021 | 155072000 | 1680000000 |
| Saturday, January 1, 2022 | 147309000 | 1766700000 |
| Sunday, January 1, 2023 | 153575000 | 2023700000 |
| Monday, January 1, 2024 | 160105000 | 2002600000 |
Igniting the spark of knowledge
In the ever-evolving landscape of industrial automation and infrastructure services, Rockwell Automation, Inc. and AECOM stand as titans. Over the past decade, from 2014 to 2024, these companies have demonstrated distinct strategies in managing their Selling, General, and Administrative (SG&A) expenses. Rockwell Automation, with its robust presence in the automation sector, has consistently maintained higher SG&A expenses, peaking at approximately $2 billion in 2023. This reflects a strategic investment in innovation and market expansion. In contrast, AECOM, a leader in infrastructure services, has shown a more conservative approach, with SG&A expenses growing from $81 million in 2014 to $160 million in 2024, marking a 98% increase. This careful scaling underscores AECOM's focus on operational efficiency. As these companies navigate the complexities of their industries, their SG&A strategies offer valuable insights into their long-term visions.
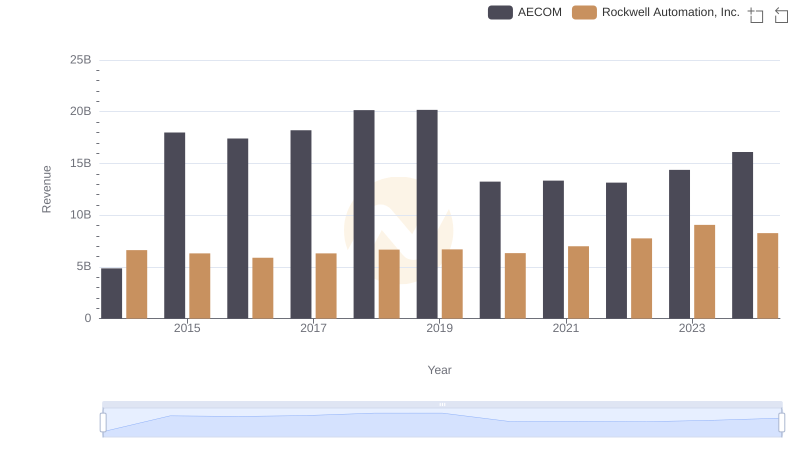
Breaking Down Revenue Trends: Rockwell Automation, Inc. vs AECOM
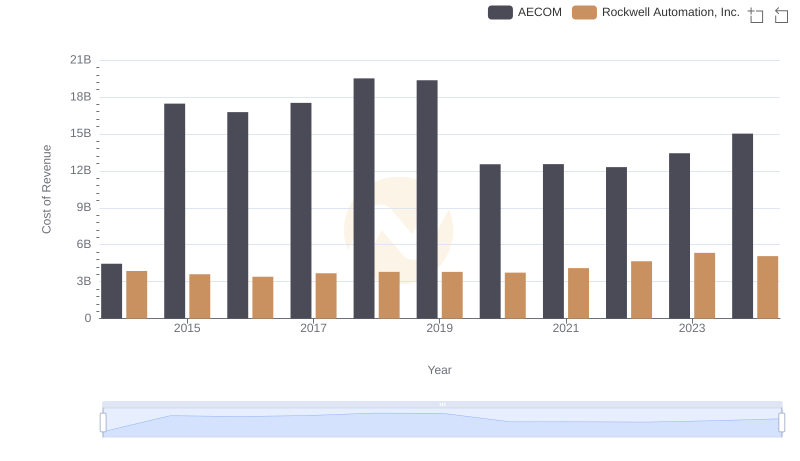
Cost of Revenue: Key Insights for Rockwell Automation, Inc. and AECOM
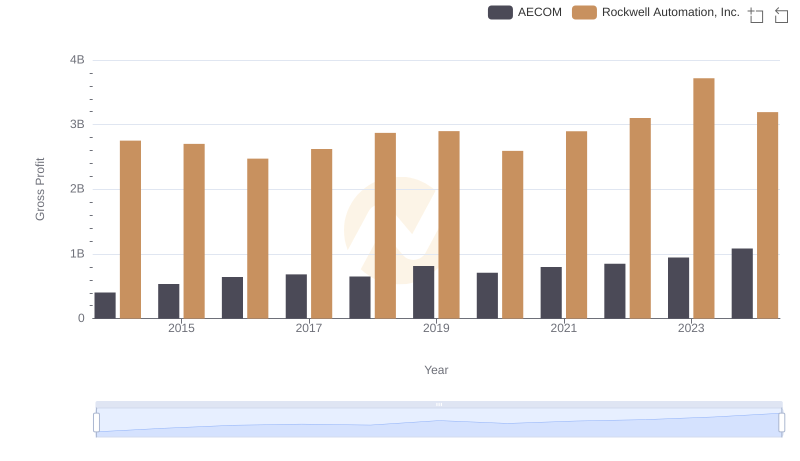
Gross Profit Analysis: Comparing Rockwell Automation, Inc. and AECOM
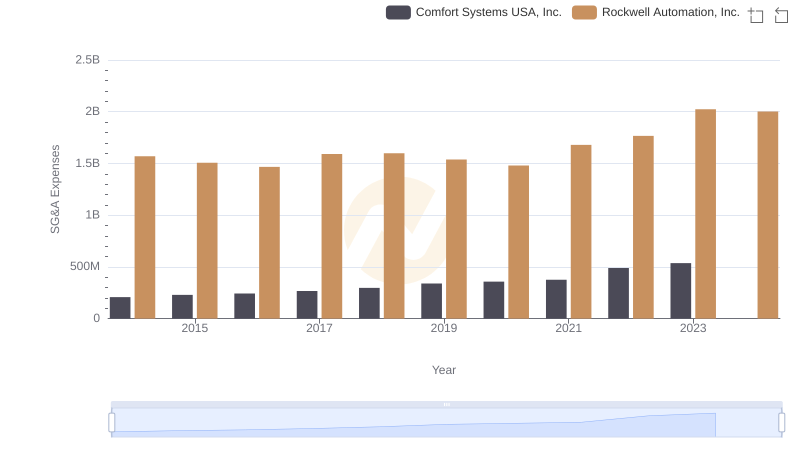
SG&A Efficiency Analysis: Comparing Rockwell Automation, Inc. and Comfort Systems USA, Inc.

SG&A Efficiency Analysis: Comparing Rockwell Automation, Inc. and U-Haul Holding Company

Comparing SG&A Expenses: Rockwell Automation, Inc. vs Pool Corporation Trends and Insights
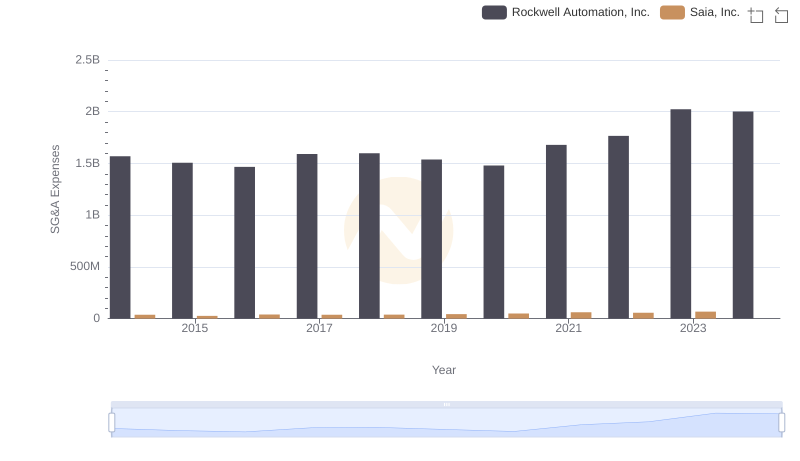
Comparing SG&A Expenses: Rockwell Automation, Inc. vs Saia, Inc. Trends and Insights

Comparative EBITDA Analysis: Rockwell Automation, Inc. vs AECOM

Who Optimizes SG&A Costs Better? Rockwell Automation, Inc. or Stanley Black & Decker, Inc.
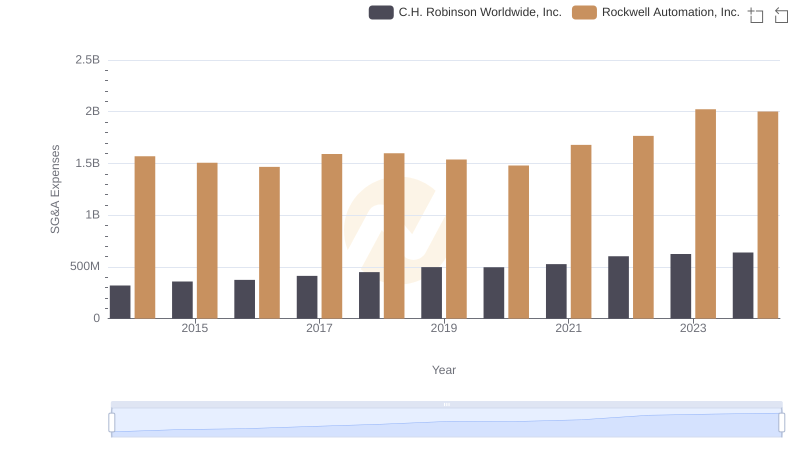
Cost Management Insights: SG&A Expenses for Rockwell Automation, Inc. and C.H. Robinson Worldwide, Inc.