| __timestamp | AECOM | Rockwell Automation, Inc. |
|---|---|---|
| Wednesday, January 1, 2014 | 417662000 | 1346000000 |
| Thursday, January 1, 2015 | 1020478000 | 1359100000 |
| Friday, January 1, 2016 | 926466000 | 1200700000 |
| Sunday, January 1, 2017 | 920292000 | 1258400000 |
| Monday, January 1, 2018 | 680801000 | 1568400000 |
| Tuesday, January 1, 2019 | 573352000 | 1150200000 |
| Wednesday, January 1, 2020 | 580017000 | 1410200000 |
| Friday, January 1, 2021 | 813356000 | 1808300000 |
| Saturday, January 1, 2022 | 826856000 | 1432100000 |
| Sunday, January 1, 2023 | 543642000 | 1990700000 |
| Monday, January 1, 2024 | 1082384000 | 1567500000 |
Unlocking the unknown
In the ever-evolving landscape of industrial automation and infrastructure services, Rockwell Automation and AECOM have been pivotal players. Over the past decade, Rockwell Automation has consistently outperformed AECOM in terms of EBITDA, showcasing a robust financial trajectory. From 2014 to 2023, Rockwell Automation's EBITDA grew by approximately 48%, peaking in 2023 with a remarkable 1.99 billion. In contrast, AECOM's EBITDA fluctuated, with a notable dip in 2019, but rebounded to reach its highest in 2024, marking a 159% increase from its lowest point in 2014.
This comparative analysis highlights Rockwell Automation's steady growth and resilience, while AECOM's journey reflects a more volatile yet promising recovery. As we look towards 2024, these trends offer valuable insights into the strategic maneuvers and market dynamics shaping these industry giants.
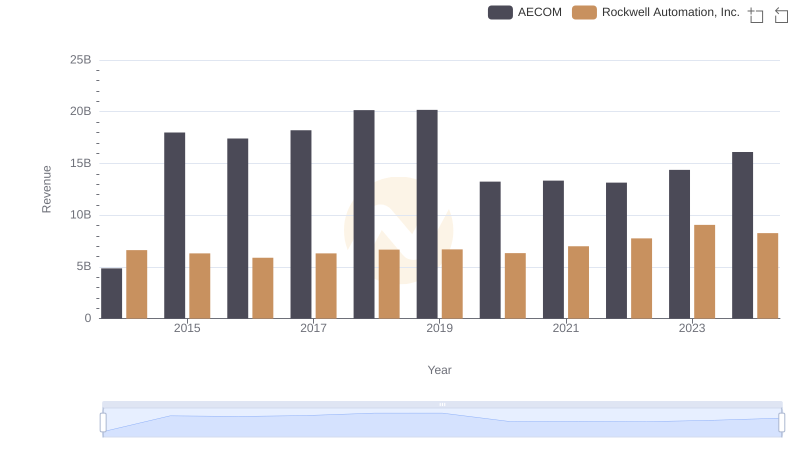
Breaking Down Revenue Trends: Rockwell Automation, Inc. vs AECOM
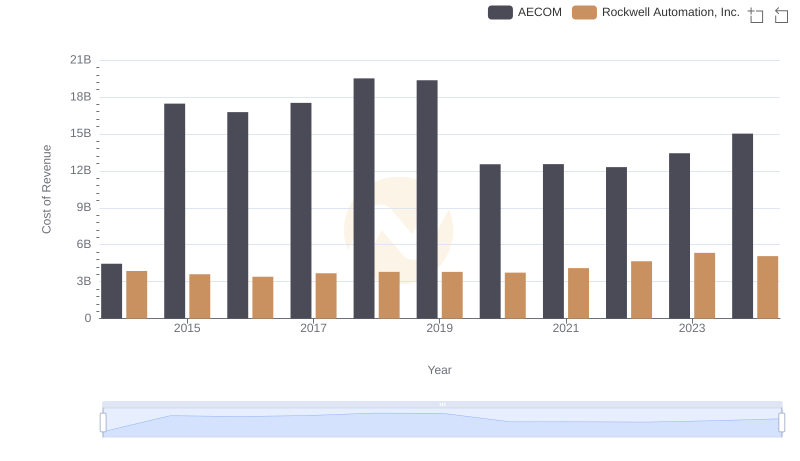
Cost of Revenue: Key Insights for Rockwell Automation, Inc. and AECOM
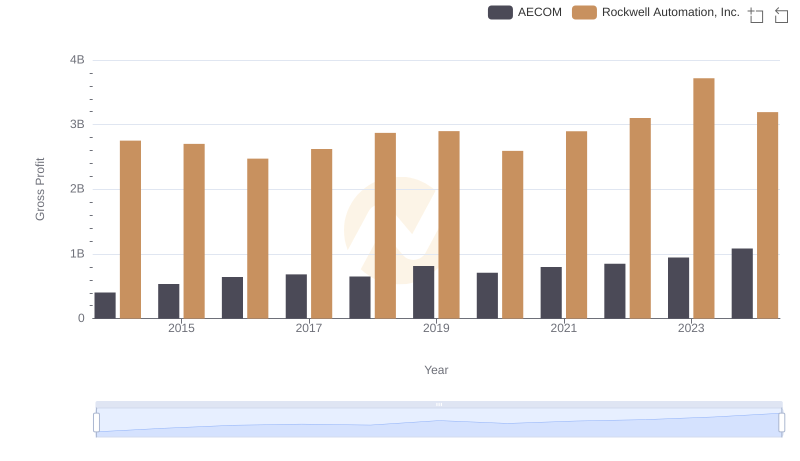
Gross Profit Analysis: Comparing Rockwell Automation, Inc. and AECOM
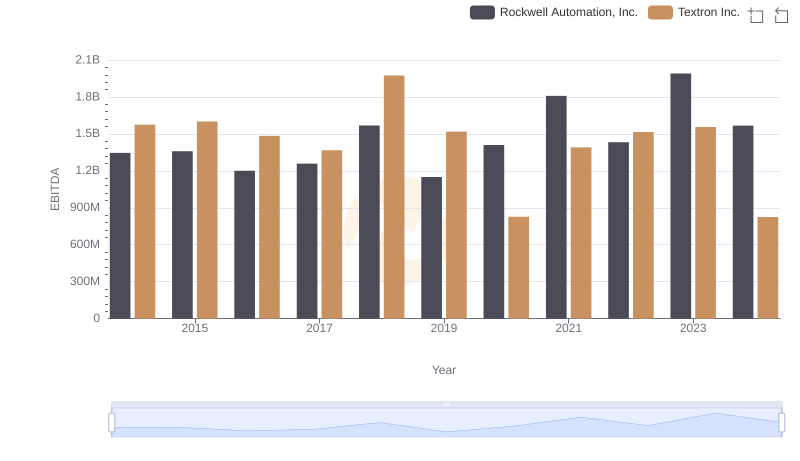
A Side-by-Side Analysis of EBITDA: Rockwell Automation, Inc. and Textron Inc.
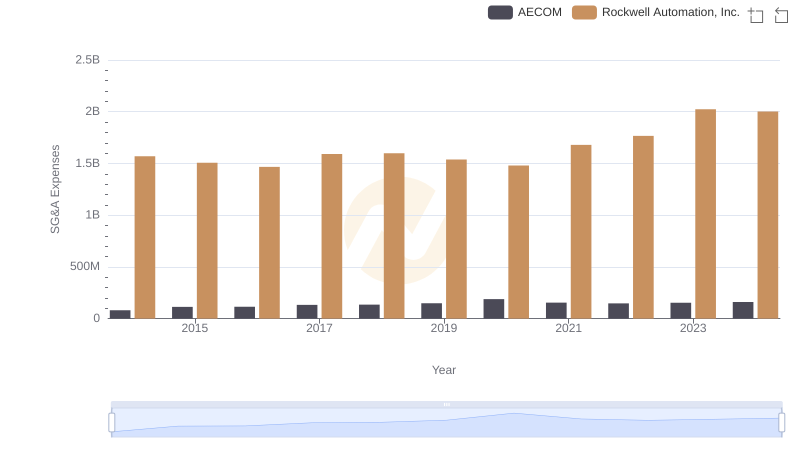
SG&A Efficiency Analysis: Comparing Rockwell Automation, Inc. and AECOM
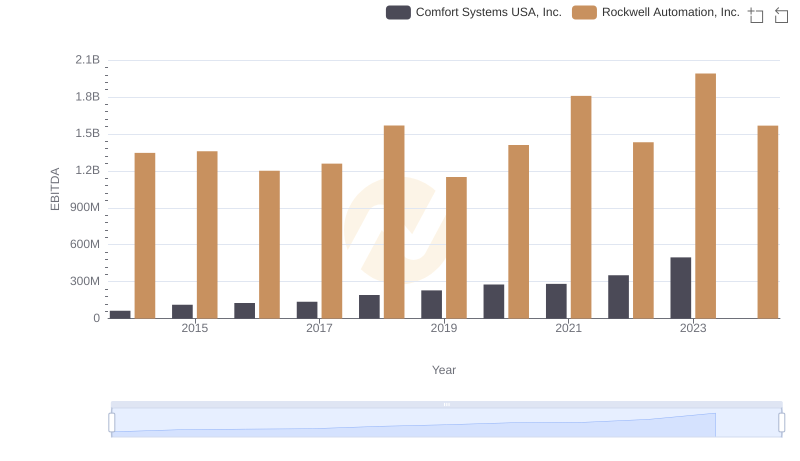
EBITDA Metrics Evaluated: Rockwell Automation, Inc. vs Comfort Systems USA, Inc.
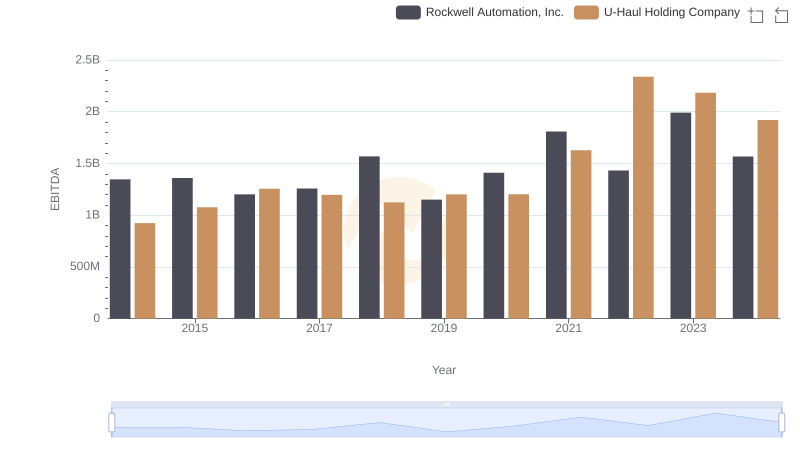
Rockwell Automation, Inc. and U-Haul Holding Company: A Detailed Examination of EBITDA Performance
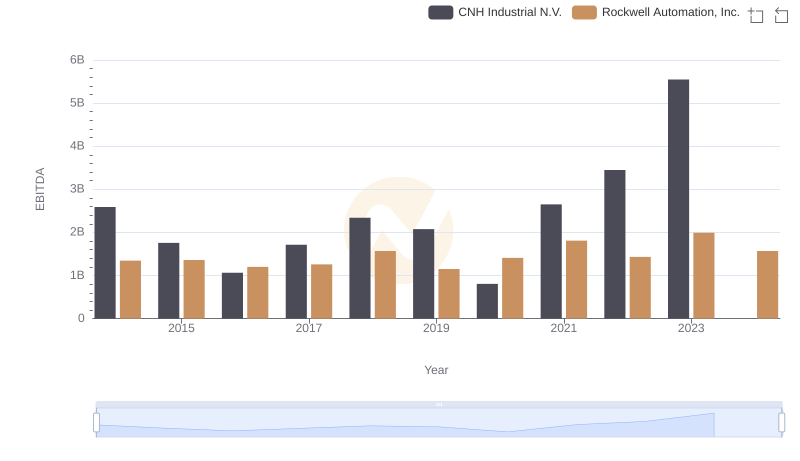
A Side-by-Side Analysis of EBITDA: Rockwell Automation, Inc. and CNH Industrial N.V.
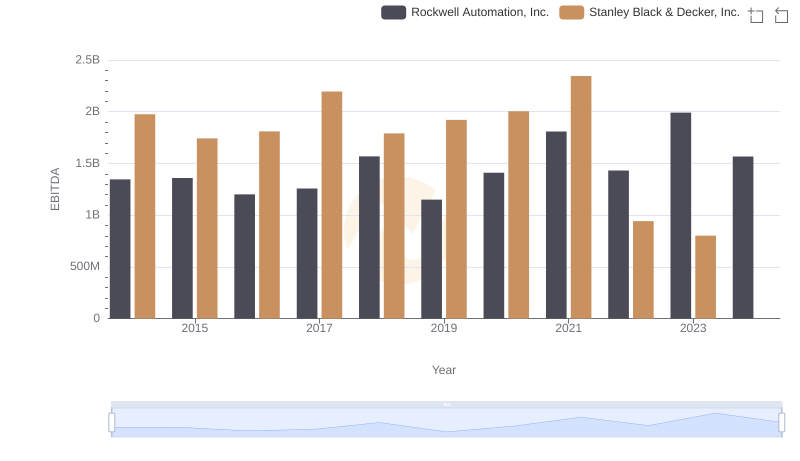
Comprehensive EBITDA Comparison: Rockwell Automation, Inc. vs Stanley Black & Decker, Inc.