| __timestamp | Lennox International Inc. | XPO Logistics, Inc. |
|---|---|---|
| Wednesday, January 1, 2014 | 903300000 | 381600000 |
| Thursday, January 1, 2015 | 947400000 | 1084800000 |
| Friday, January 1, 2016 | 1076500000 | 2139300000 |
| Sunday, January 1, 2017 | 1125200000 | 2279700000 |
| Monday, January 1, 2018 | 1111200000 | 2541000000 |
| Tuesday, January 1, 2019 | 1079800000 | 2666000000 |
| Wednesday, January 1, 2020 | 1040100000 | 2563000000 |
| Friday, January 1, 2021 | 1188400000 | 1994000000 |
| Saturday, January 1, 2022 | 1284700000 | 1227000000 |
| Sunday, January 1, 2023 | 1547800000 | 770000000 |
| Monday, January 1, 2024 | 1771900000 | 915000000 |
Unlocking the unknown
In the ever-evolving landscape of industrial giants, Lennox International Inc. and XPO Logistics, Inc. have carved distinct paths over the past decade. From 2014 to 2023, Lennox International's gross profit surged by approximately 96%, showcasing a robust growth trajectory. In contrast, XPO Logistics experienced a more volatile journey, peaking in 2019 with a gross profit nearly seven times its 2014 figure, before witnessing a significant decline by 2023.
This comparison highlights the dynamic nature of the industrial sector, where strategic decisions and market conditions can lead to divergent financial outcomes.
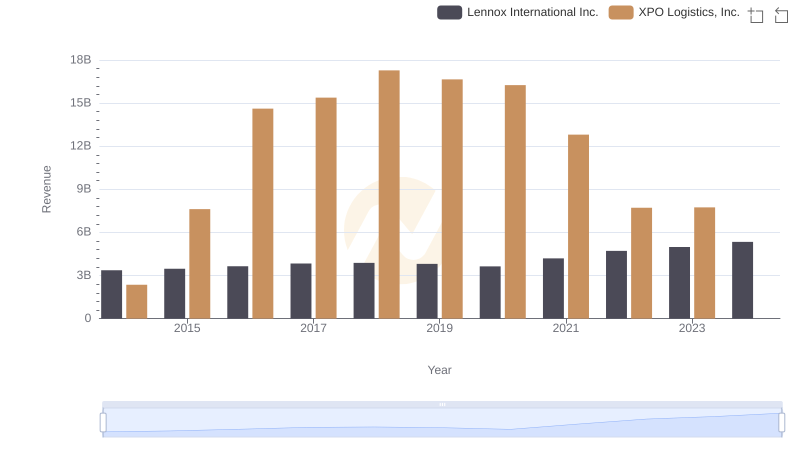
Revenue Showdown: Lennox International Inc. vs XPO Logistics, Inc.
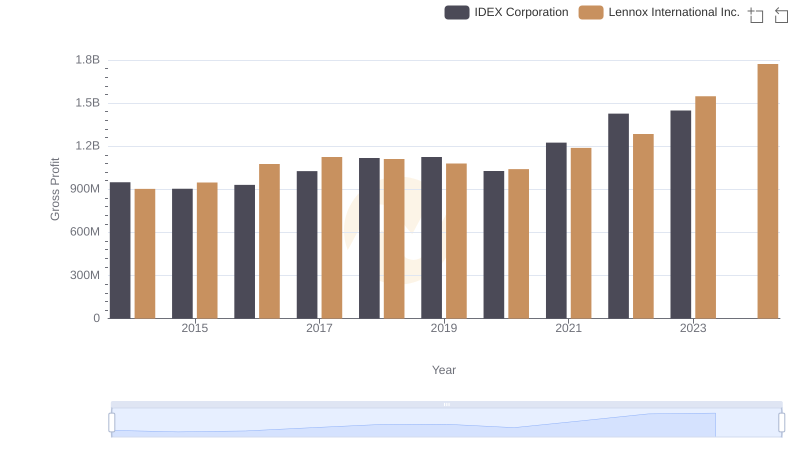
Gross Profit Comparison: Lennox International Inc. and IDEX Corporation Trends
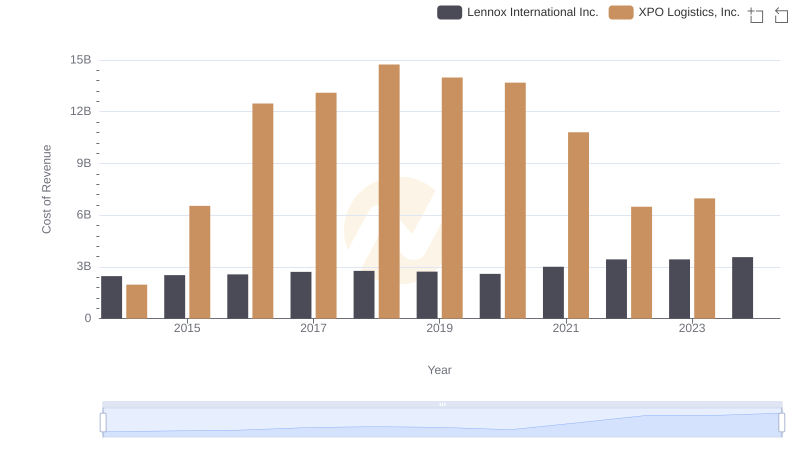
Lennox International Inc. vs XPO Logistics, Inc.: Efficiency in Cost of Revenue Explored
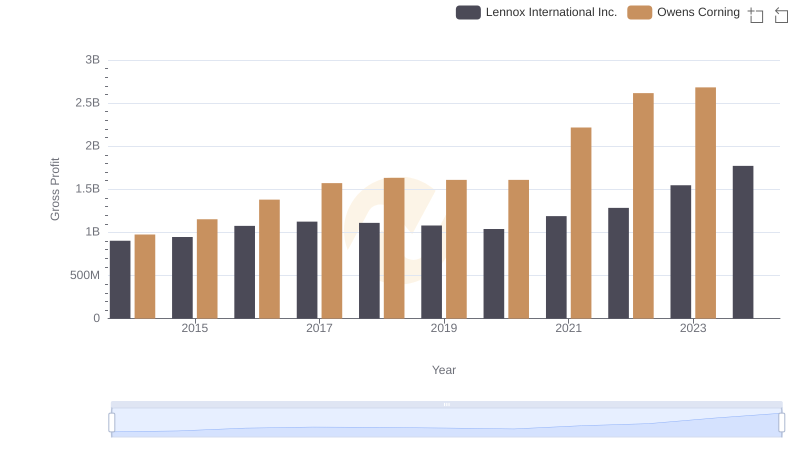
Gross Profit Analysis: Comparing Lennox International Inc. and Owens Corning
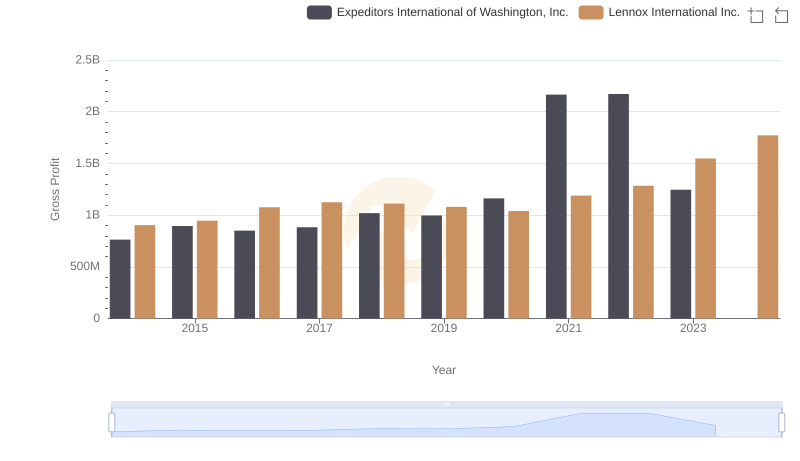
Gross Profit Trends Compared: Lennox International Inc. vs Expeditors International of Washington, Inc.
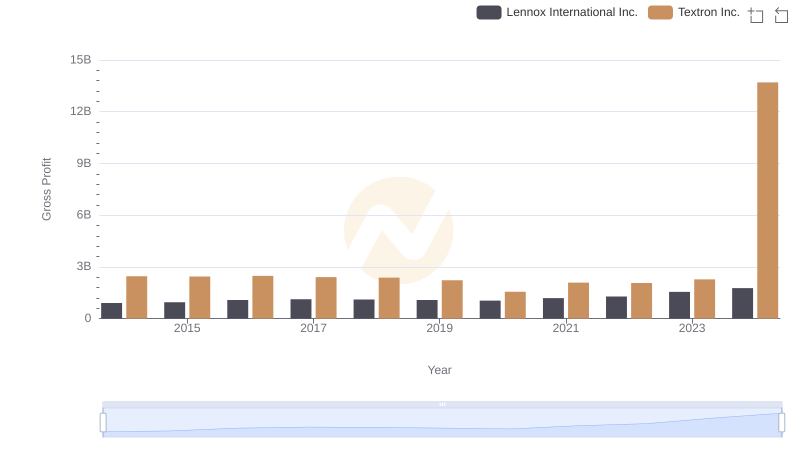
Gross Profit Comparison: Lennox International Inc. and Textron Inc. Trends
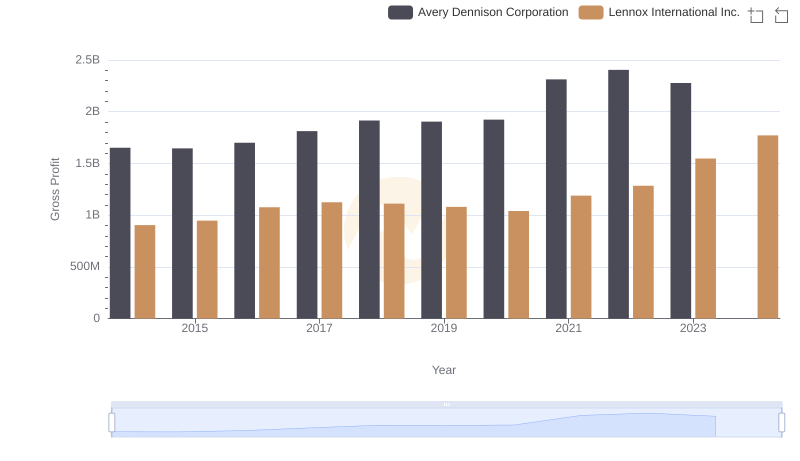
Gross Profit Analysis: Comparing Lennox International Inc. and Avery Dennison Corporation
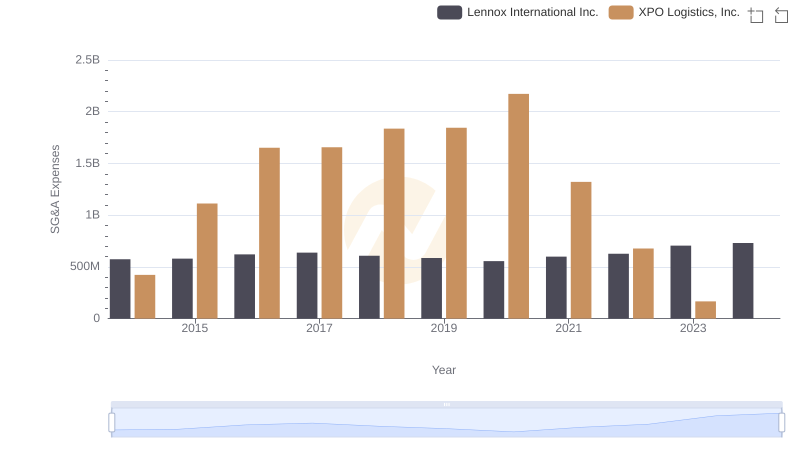
Lennox International Inc. vs XPO Logistics, Inc.: SG&A Expense Trends
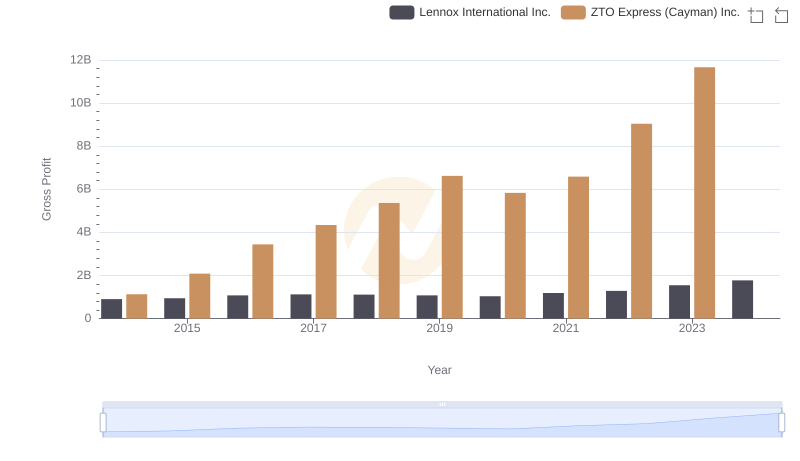
Gross Profit Comparison: Lennox International Inc. and ZTO Express (Cayman) Inc. Trends
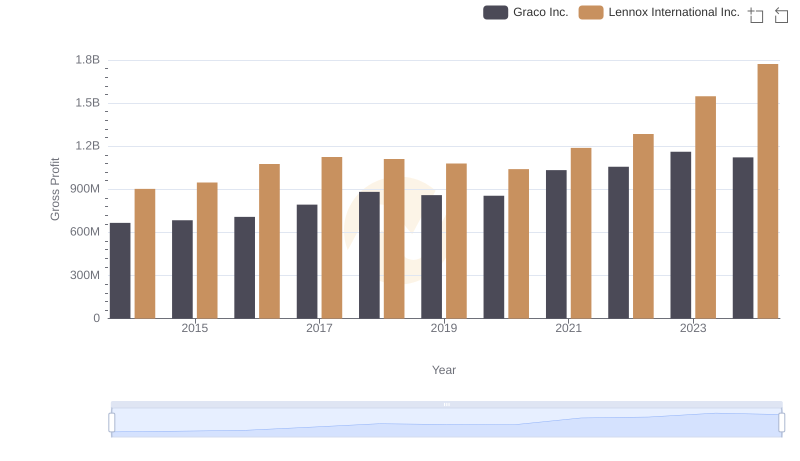
Lennox International Inc. and Graco Inc.: A Detailed Gross Profit Analysis
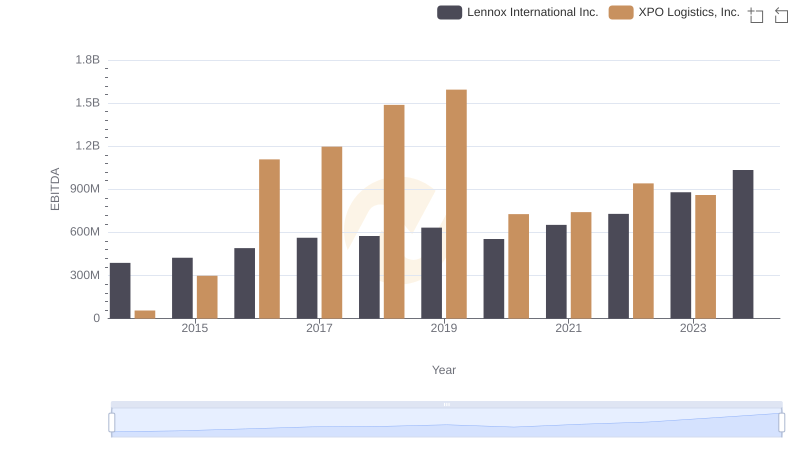
A Professional Review of EBITDA: Lennox International Inc. Compared to XPO Logistics, Inc.
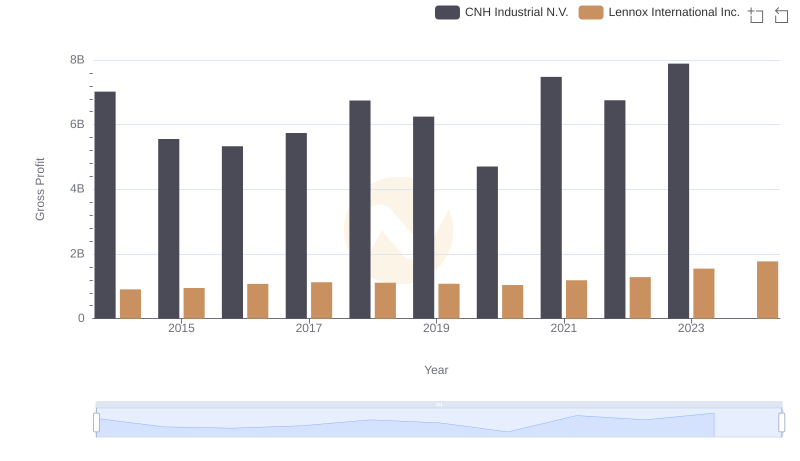
Lennox International Inc. and CNH Industrial N.V.: A Detailed Gross Profit Analysis