| __timestamp | Amphenol Corporation | Intuit Inc. |
|---|---|---|
| Wednesday, January 1, 2014 | 3651700000 | 668000000 |
| Thursday, January 1, 2015 | 3789200000 | 725000000 |
| Friday, January 1, 2016 | 4246400000 | 752000000 |
| Sunday, January 1, 2017 | 4701400000 | 809000000 |
| Monday, January 1, 2018 | 5547100000 | 977000000 |
| Tuesday, January 1, 2019 | 5609400000 | 1167000000 |
| Wednesday, January 1, 2020 | 5934800000 | 1378000000 |
| Friday, January 1, 2021 | 7474500000 | 1683000000 |
| Saturday, January 1, 2022 | 8594800000 | 2406000000 |
| Sunday, January 1, 2023 | 8470600000 | 3143000000 |
| Monday, January 1, 2024 | 10083000000 | 3465000000 |
Unleashing the power of data
In the ever-evolving landscape of corporate finance, understanding the cost of revenue is crucial for investors and analysts alike. This metric, which represents the direct costs attributable to the production of goods sold by a company, offers insights into operational efficiency and profitability. From 2014 to 2024, Amphenol Corporation and Intuit Inc. have shown distinct trajectories in their cost of revenue.
Amphenol Corporation, a leader in electronic and fiber optic connectors, has seen its cost of revenue grow by approximately 176% over the decade, reflecting its expanding market presence and production scale. In contrast, Intuit Inc., renowned for its financial software, has experienced a 418% increase, indicating significant growth in its service offerings and customer base.
These trends highlight the dynamic nature of these industries and underscore the importance of strategic cost management in maintaining competitive advantage.
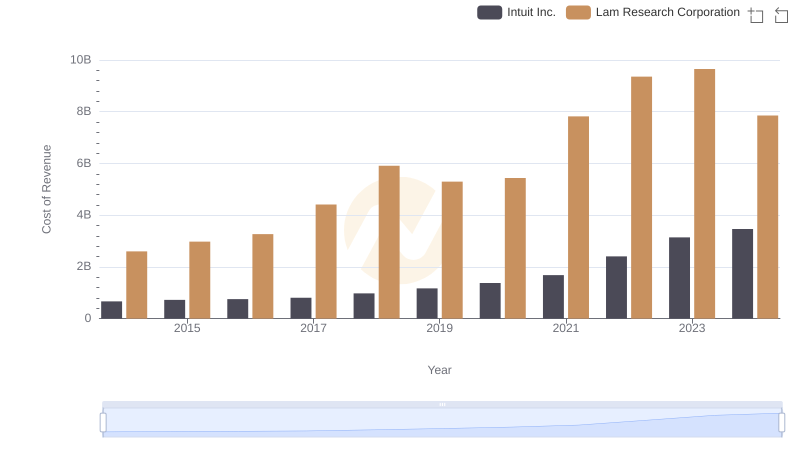
Analyzing Cost of Revenue: Intuit Inc. and Lam Research Corporation
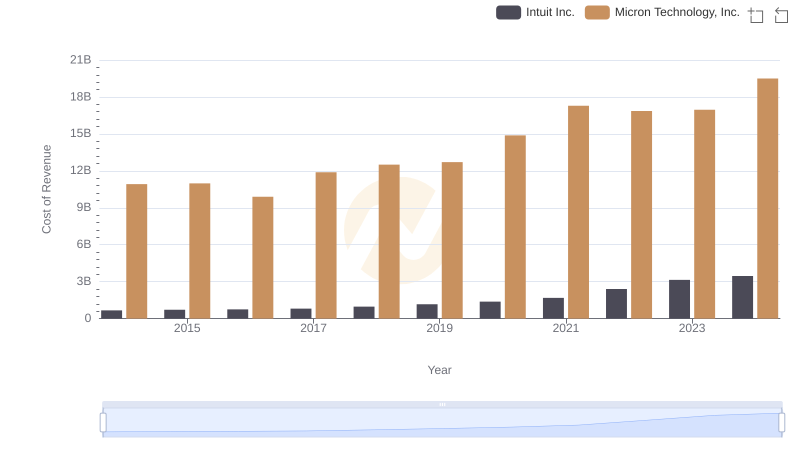
Cost of Revenue Trends: Intuit Inc. vs Micron Technology, Inc.
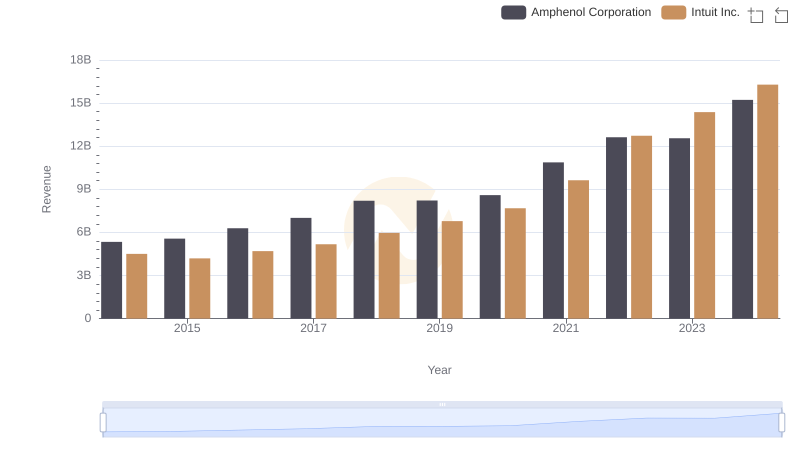
Revenue Insights: Intuit Inc. and Amphenol Corporation Performance Compared
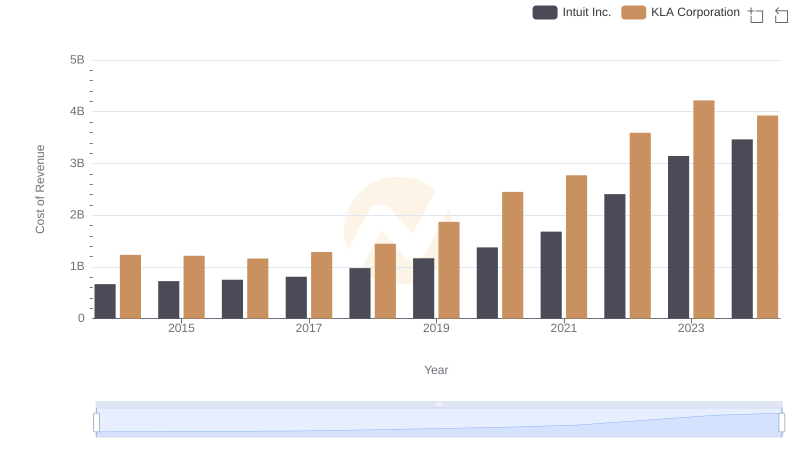
Cost of Revenue Trends: Intuit Inc. vs KLA Corporation
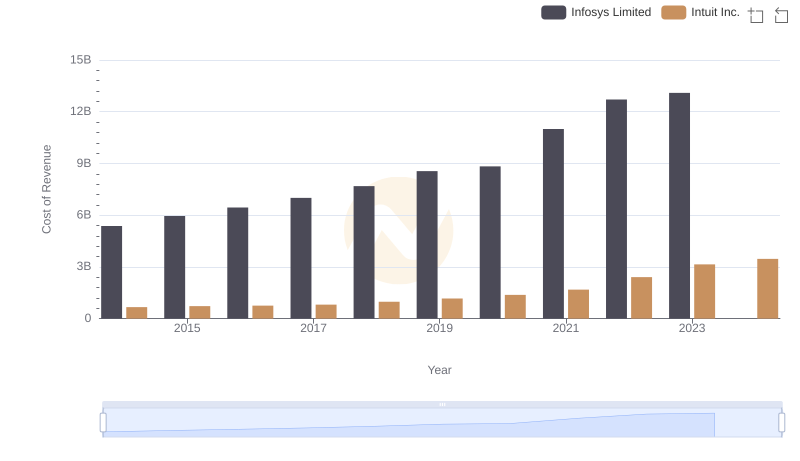
Comparing Cost of Revenue Efficiency: Intuit Inc. vs Infosys Limited
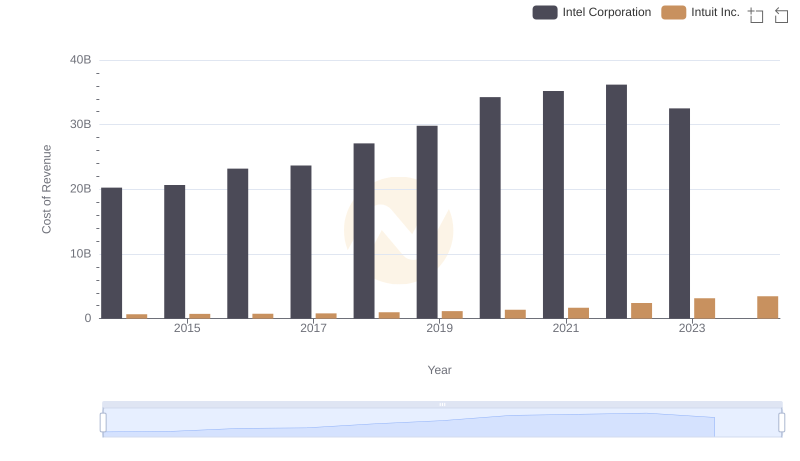
Intuit Inc. vs Intel Corporation: Efficiency in Cost of Revenue Explored
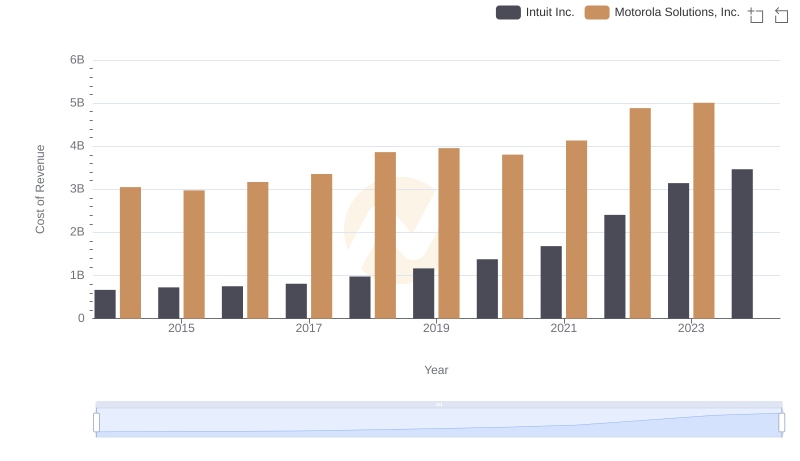
Cost Insights: Breaking Down Intuit Inc. and Motorola Solutions, Inc.'s Expenses
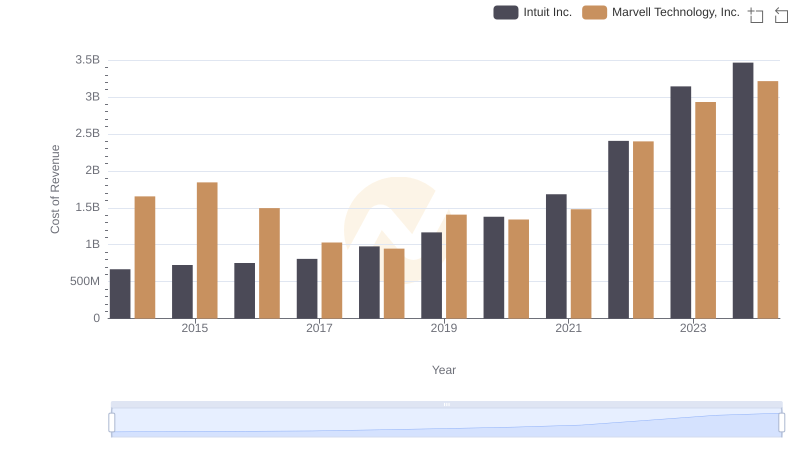
Cost of Revenue Comparison: Intuit Inc. vs Marvell Technology, Inc.
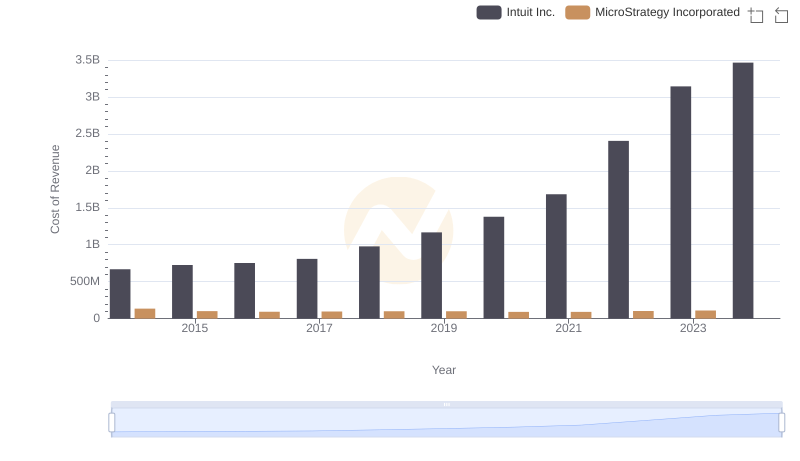
Analyzing Cost of Revenue: Intuit Inc. and MicroStrategy Incorporated
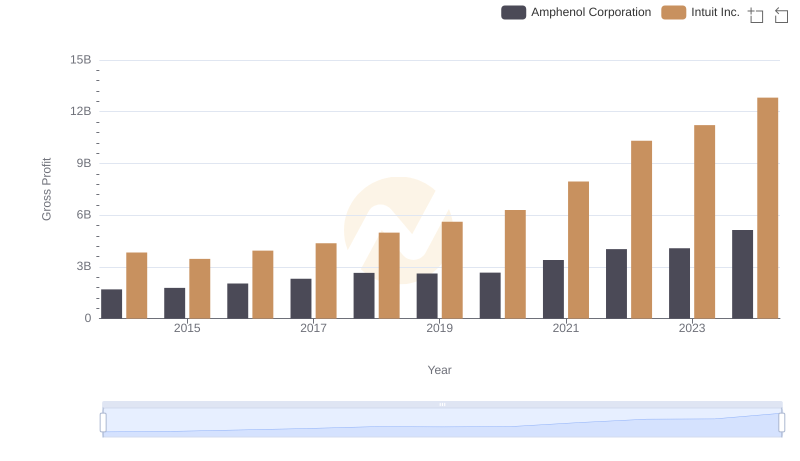
Gross Profit Analysis: Comparing Intuit Inc. and Amphenol Corporation
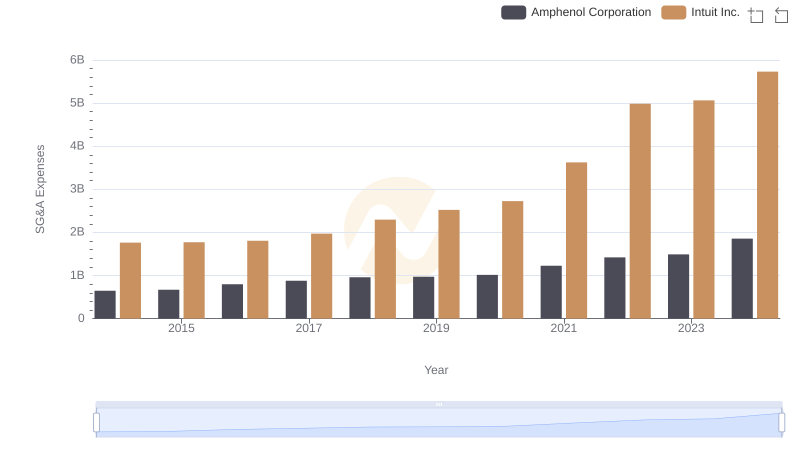
Who Optimizes SG&A Costs Better? Intuit Inc. or Amphenol Corporation
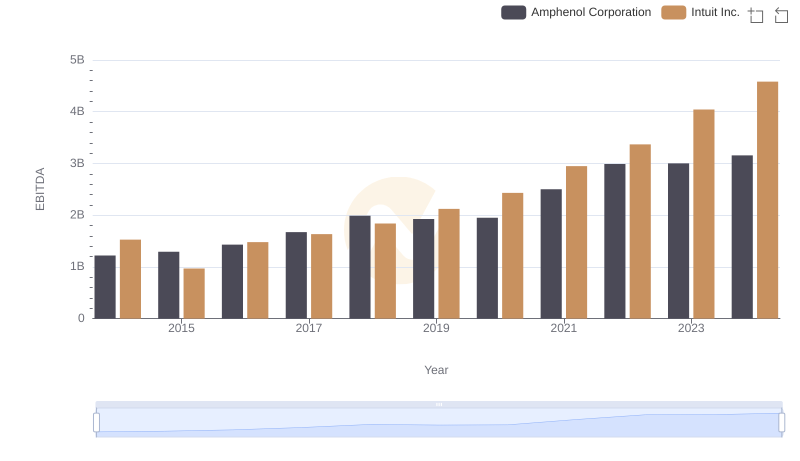
A Side-by-Side Analysis of EBITDA: Intuit Inc. and Amphenol Corporation