| __timestamp | Global Payments Inc. | Owens Corning |
|---|---|---|
| Wednesday, January 1, 2014 | 1295014000 | 487000000 |
| Thursday, January 1, 2015 | 1325567000 | 525000000 |
| Friday, January 1, 2016 | 1411096000 | 584000000 |
| Sunday, January 1, 2017 | 1488258000 | 620000000 |
| Monday, January 1, 2018 | 1534297000 | 700000000 |
| Tuesday, January 1, 2019 | 2046672000 | 698000000 |
| Wednesday, January 1, 2020 | 2878878000 | 664000000 |
| Friday, January 1, 2021 | 3391161000 | 757000000 |
| Saturday, January 1, 2022 | 3524578000 | 803000000 |
| Sunday, January 1, 2023 | 4073768000 | 831000000 |
| Monday, January 1, 2024 | 4285307000 |
Infusing magic into the data realm
In the ever-evolving landscape of corporate finance, understanding the spending patterns of industry giants can offer valuable insights. Over the past decade, Global Payments Inc. and Owens Corning have showcased distinct trajectories in their Selling, General, and Administrative (SG&A) expenses.
From 2014 to 2023, Global Payments Inc. has seen a remarkable increase in SG&A expenses, growing by over 200%. This surge reflects the company's aggressive expansion and strategic investments. In contrast, Owens Corning's SG&A expenses have grown at a more modest pace, increasing by approximately 70% over the same period. This steady growth aligns with the company's focus on sustainable development and operational efficiency.
These contrasting spending patterns highlight the diverse strategies employed by companies in different sectors, offering a fascinating glimpse into their financial priorities and market positioning.
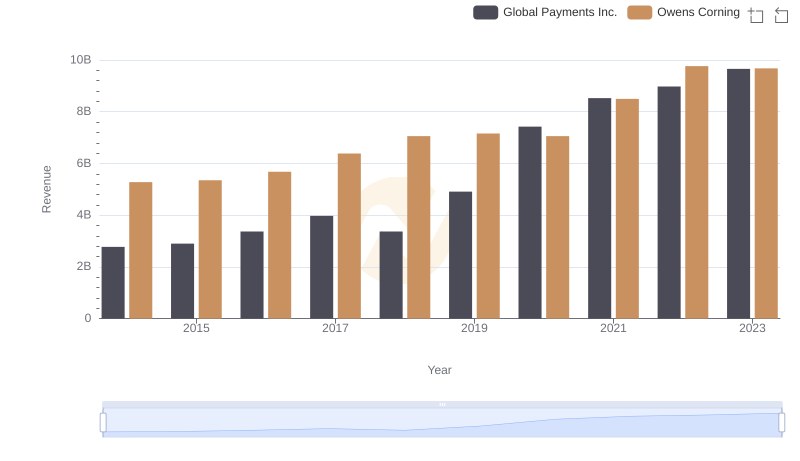
Global Payments Inc. or Owens Corning: Who Leads in Yearly Revenue?
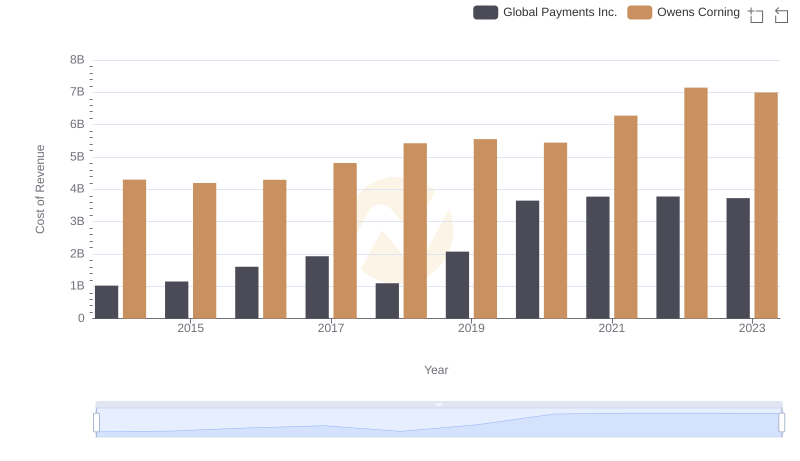
Cost of Revenue Trends: Global Payments Inc. vs Owens Corning
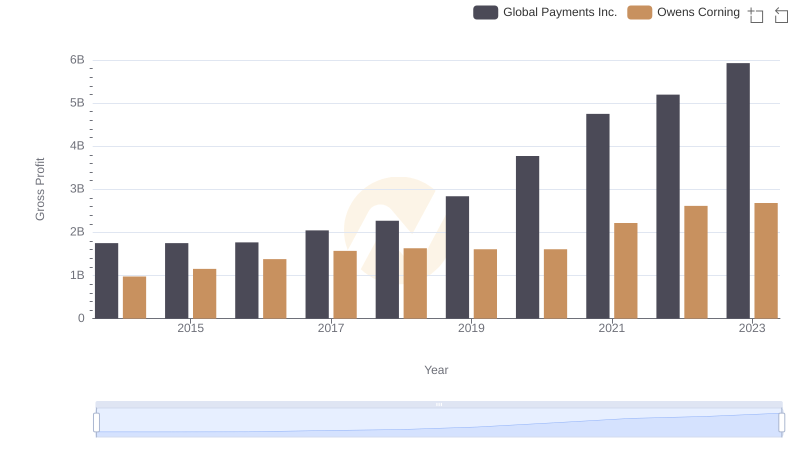
Global Payments Inc. and Owens Corning: A Detailed Gross Profit Analysis
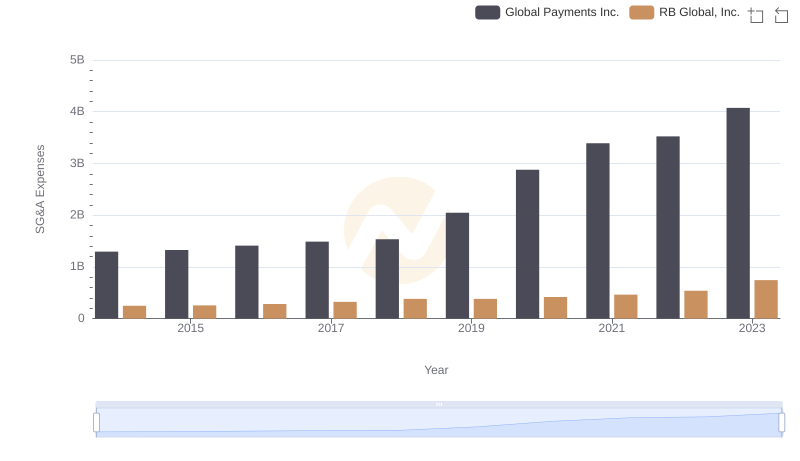
Cost Management Insights: SG&A Expenses for Global Payments Inc. and RB Global, Inc.
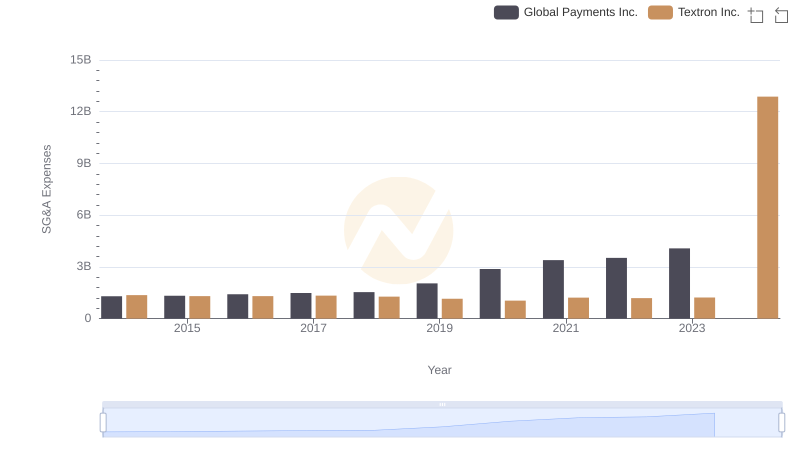
Cost Management Insights: SG&A Expenses for Global Payments Inc. and Textron Inc.
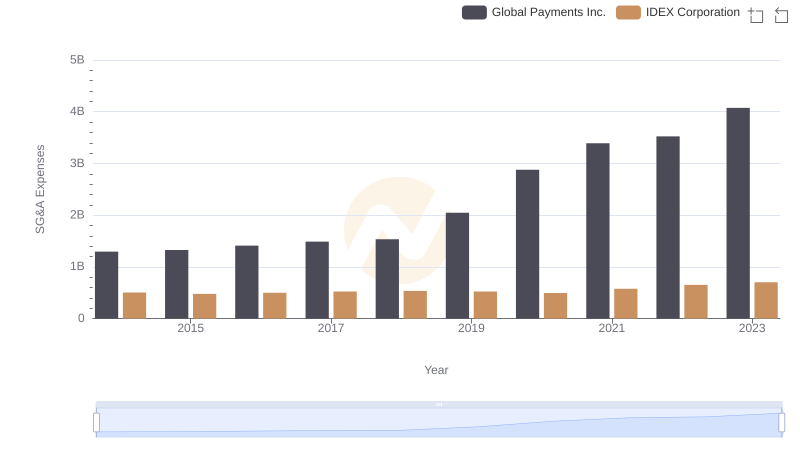
Who Optimizes SG&A Costs Better? Global Payments Inc. or IDEX Corporation
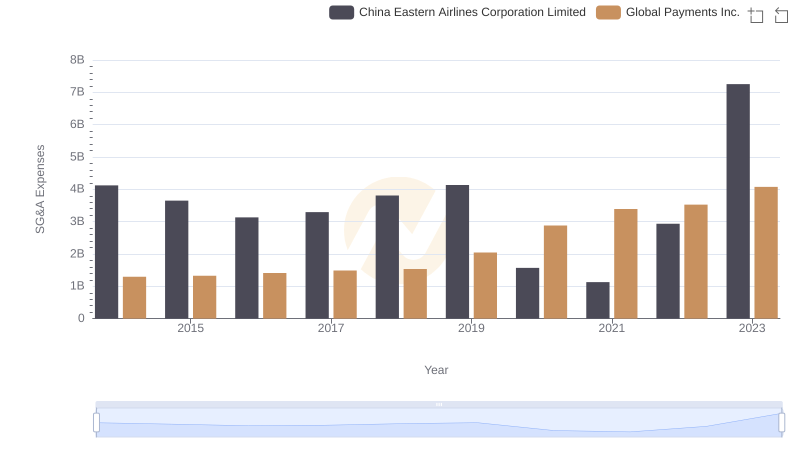
Global Payments Inc. vs China Eastern Airlines Corporation Limited: SG&A Expense Trends
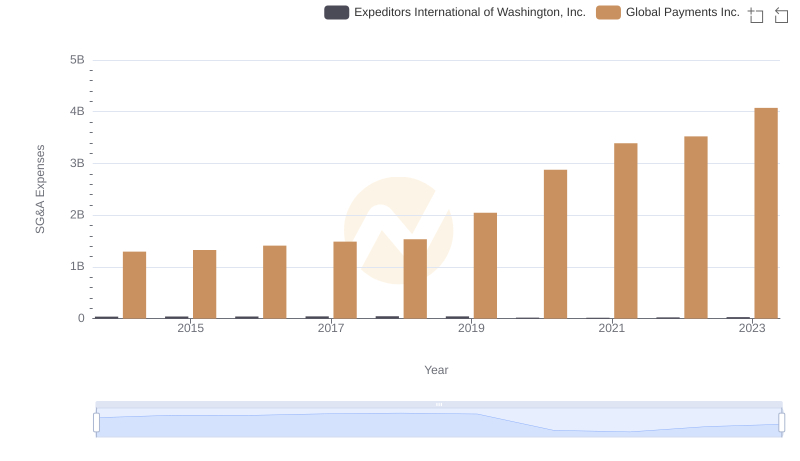
Breaking Down SG&A Expenses: Global Payments Inc. vs Expeditors International of Washington, Inc.
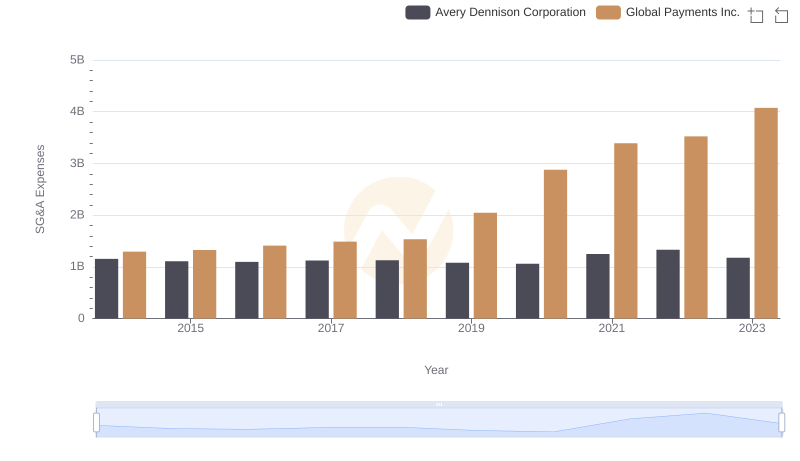
Comparing SG&A Expenses: Global Payments Inc. vs Avery Dennison Corporation Trends and Insights
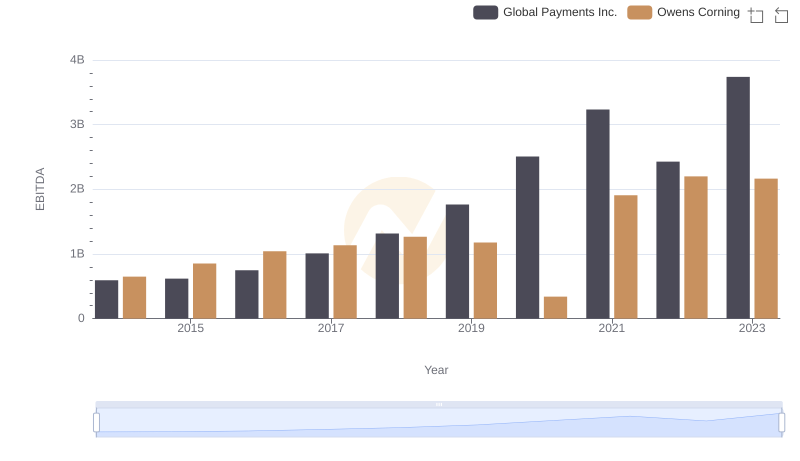
EBITDA Analysis: Evaluating Global Payments Inc. Against Owens Corning
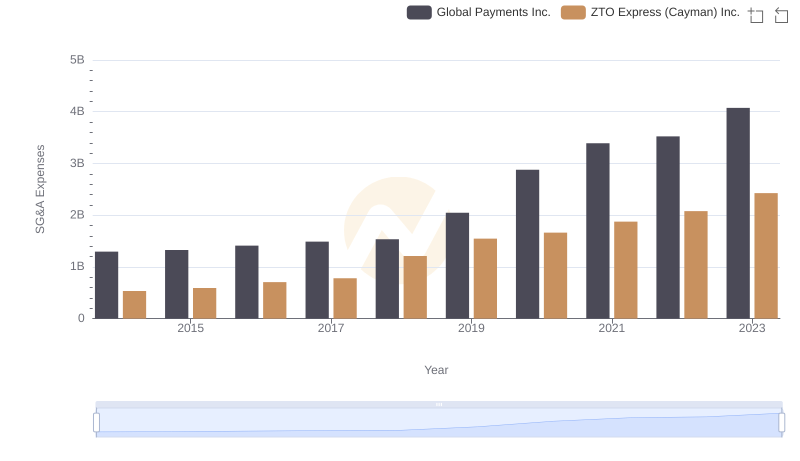
Selling, General, and Administrative Costs: Global Payments Inc. vs ZTO Express (Cayman) Inc.
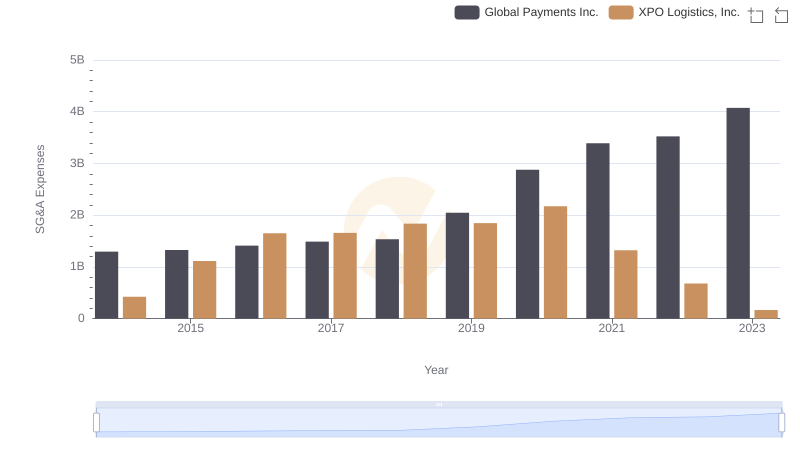
SG&A Efficiency Analysis: Comparing Global Payments Inc. and XPO Logistics, Inc.