| __timestamp | Global Payments Inc. | Textron Inc. |
|---|---|---|
| Wednesday, January 1, 2014 | 1295014000 | 1361000000 |
| Thursday, January 1, 2015 | 1325567000 | 1304000000 |
| Friday, January 1, 2016 | 1411096000 | 1304000000 |
| Sunday, January 1, 2017 | 1488258000 | 1337000000 |
| Monday, January 1, 2018 | 1534297000 | 1275000000 |
| Tuesday, January 1, 2019 | 2046672000 | 1152000000 |
| Wednesday, January 1, 2020 | 2878878000 | 1045000000 |
| Friday, January 1, 2021 | 3391161000 | 1221000000 |
| Saturday, January 1, 2022 | 3524578000 | 1186000000 |
| Sunday, January 1, 2023 | 4073768000 | 1225000000 |
| Monday, January 1, 2024 | 4285307000 | 1156000000 |
Unlocking the unknown
In the ever-evolving landscape of corporate finance, managing Selling, General, and Administrative (SG&A) expenses is crucial for maintaining profitability. This analysis delves into the SG&A trends of Global Payments Inc. and Textron Inc. over the past decade. From 2014 to 2023, Global Payments Inc. saw a staggering 214% increase in SG&A expenses, peaking in 2023. This rise reflects strategic investments and expansion efforts. In contrast, Textron Inc. maintained a relatively stable SG&A profile, with a notable spike in 2024, suggesting a potential strategic shift or one-time expense. Understanding these trends offers valuable insights into each company's operational strategies and financial health. As businesses navigate the complexities of cost management, these insights underscore the importance of balancing growth with efficiency.
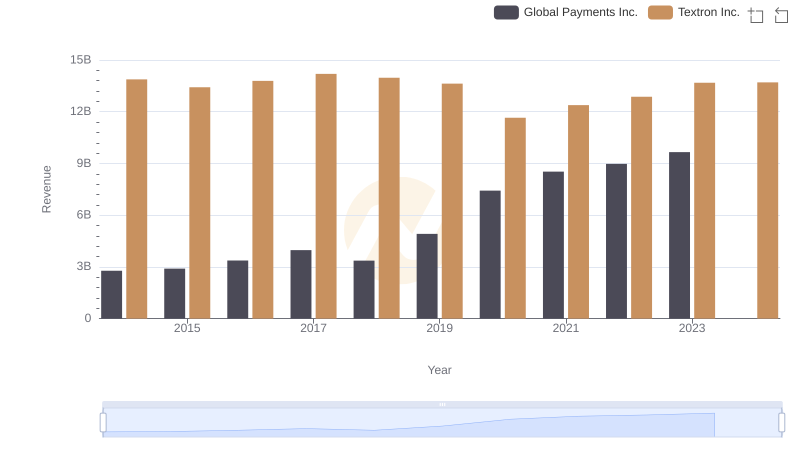
Global Payments Inc. and Textron Inc.: A Comprehensive Revenue Analysis
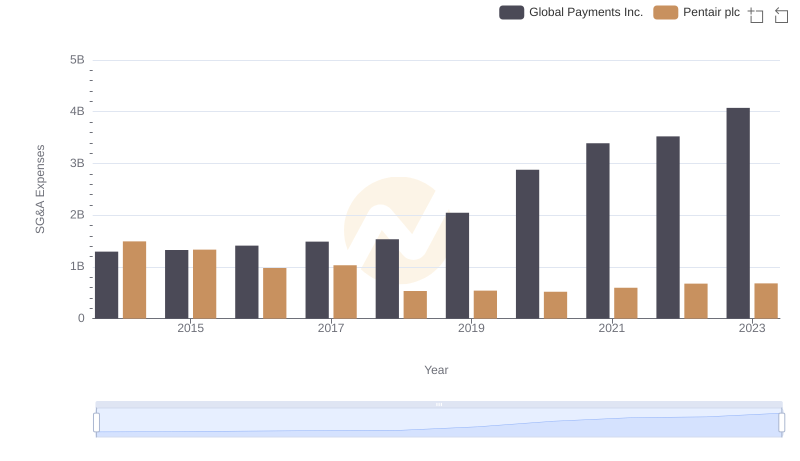
Selling, General, and Administrative Costs: Global Payments Inc. vs Pentair plc
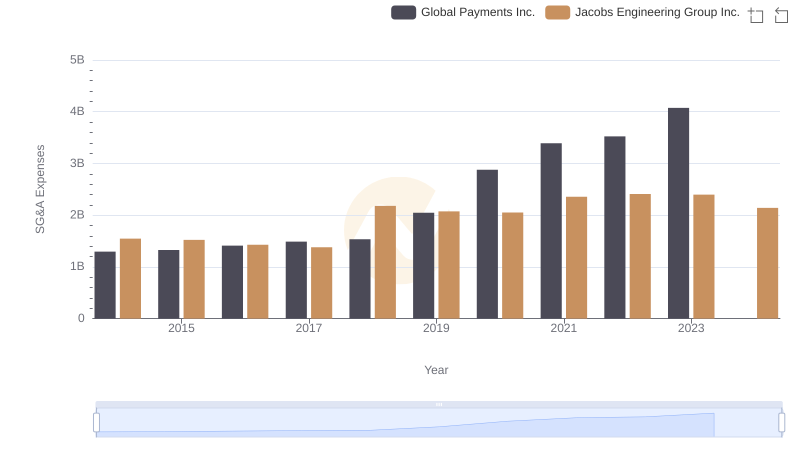
Cost Management Insights: SG&A Expenses for Global Payments Inc. and Jacobs Engineering Group Inc.
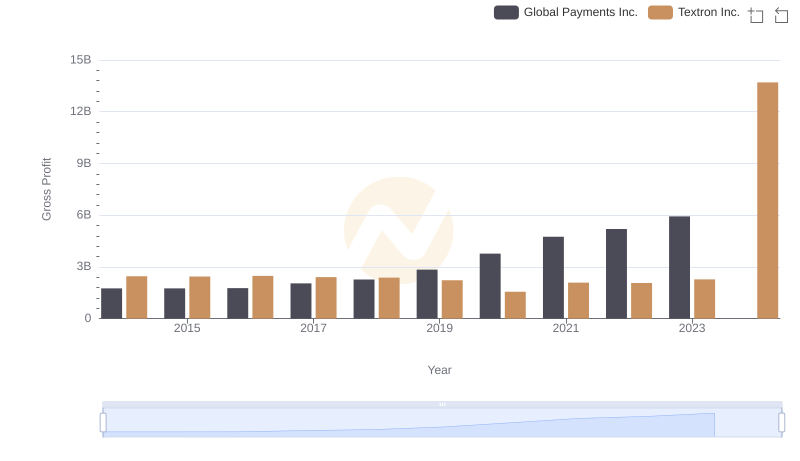
Key Insights on Gross Profit: Global Payments Inc. vs Textron Inc.
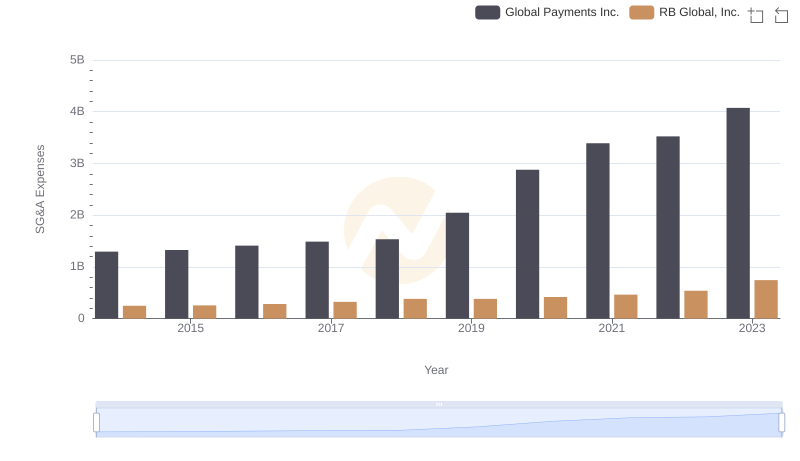
Cost Management Insights: SG&A Expenses for Global Payments Inc. and RB Global, Inc.
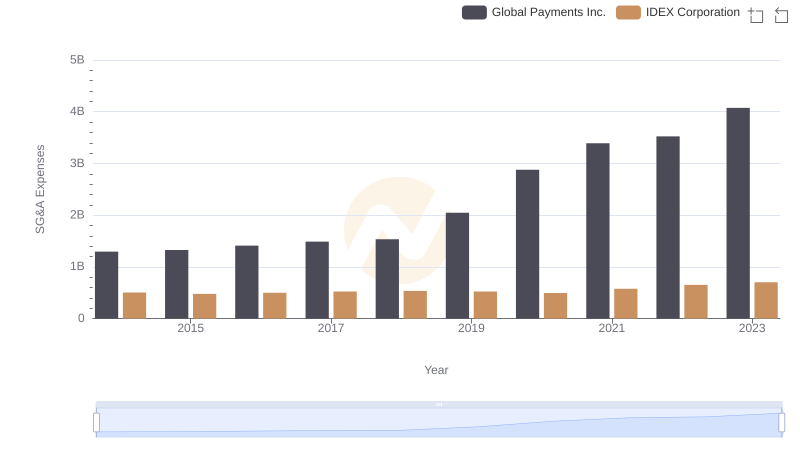
Who Optimizes SG&A Costs Better? Global Payments Inc. or IDEX Corporation
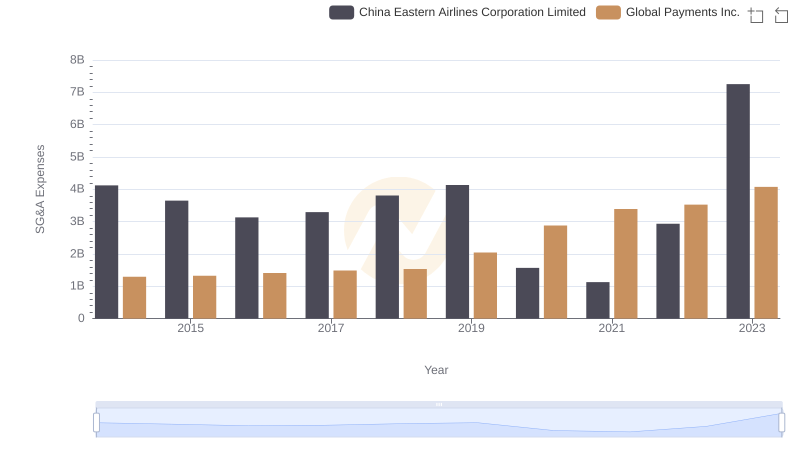
Global Payments Inc. vs China Eastern Airlines Corporation Limited: SG&A Expense Trends
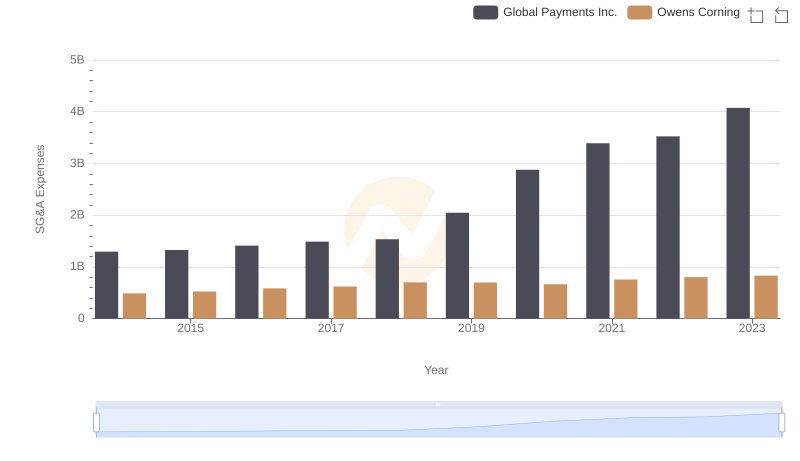
Global Payments Inc. and Owens Corning: SG&A Spending Patterns Compared
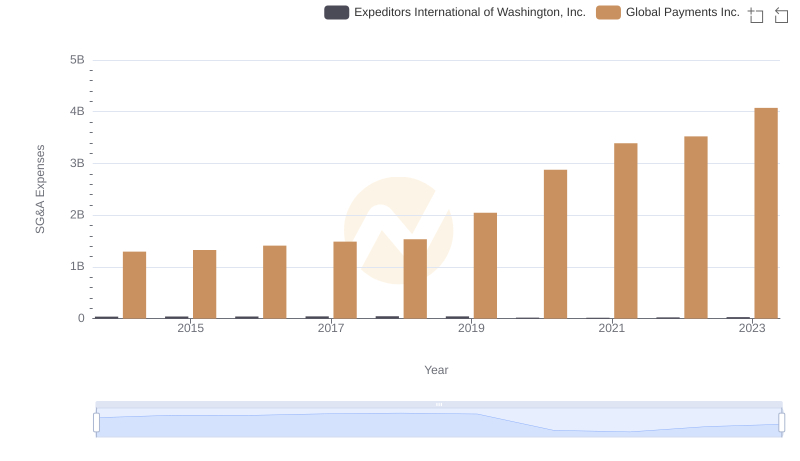
Breaking Down SG&A Expenses: Global Payments Inc. vs Expeditors International of Washington, Inc.
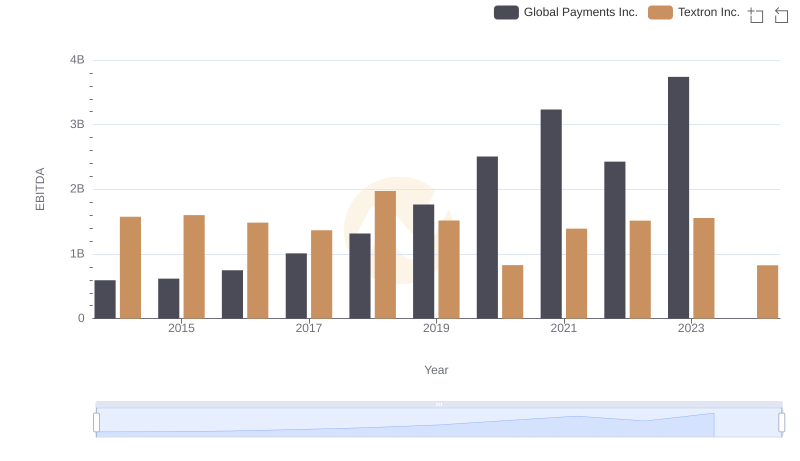
EBITDA Analysis: Evaluating Global Payments Inc. Against Textron Inc.
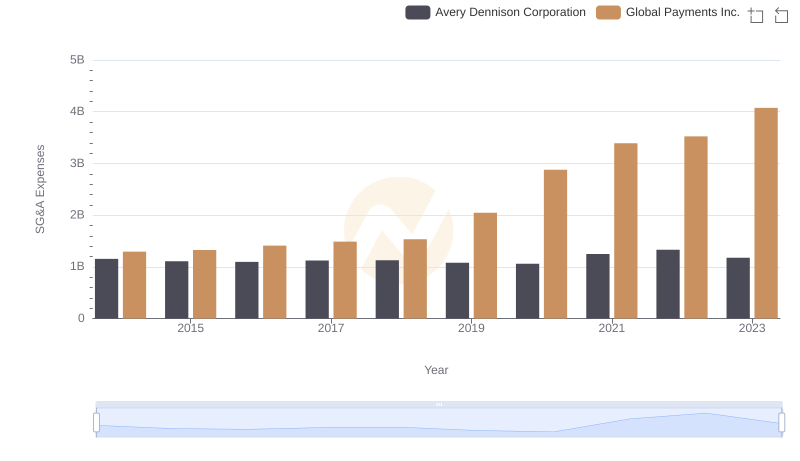
Comparing SG&A Expenses: Global Payments Inc. vs Avery Dennison Corporation Trends and Insights
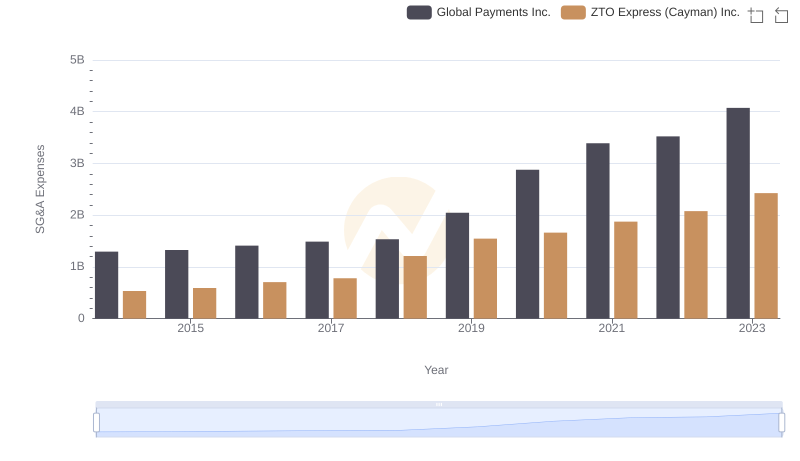
Selling, General, and Administrative Costs: Global Payments Inc. vs ZTO Express (Cayman) Inc.