| __timestamp | Global Payments Inc. | Owens Corning |
|---|---|---|
| Wednesday, January 1, 2014 | 2773718000 | 5276000000 |
| Thursday, January 1, 2015 | 2898150000 | 5350000000 |
| Friday, January 1, 2016 | 3370976000 | 5677000000 |
| Sunday, January 1, 2017 | 3975163000 | 6384000000 |
| Monday, January 1, 2018 | 3366366000 | 7057000000 |
| Tuesday, January 1, 2019 | 4911892000 | 7160000000 |
| Wednesday, January 1, 2020 | 7423558000 | 7055000000 |
| Friday, January 1, 2021 | 8523762000 | 8498000000 |
| Saturday, January 1, 2022 | 8975515000 | 9761000000 |
| Sunday, January 1, 2023 | 9654419000 | 9677000000 |
| Monday, January 1, 2024 | 10105894000 |
In pursuit of knowledge
In the ever-evolving landscape of global commerce, two giants, Global Payments Inc. and Owens Corning, have showcased remarkable revenue trajectories over the past decade. From 2014 to 2023, Global Payments Inc. has seen its revenue soar by approximately 248%, starting from $2.8 billion and reaching nearly $9.7 billion. This growth reflects the company's strategic expansions and technological advancements in the payment processing industry.
Meanwhile, Owens Corning, a leader in building materials, has demonstrated a steady revenue increase of about 83% over the same period, from $5.3 billion to $9.7 billion. This growth underscores the company's resilience and adaptability in the face of market fluctuations.
By 2023, both companies are neck and neck, with revenues just shy of $9.7 billion, highlighting their competitive edge and market leadership. This comparison offers a fascinating glimpse into how different industries can achieve similar financial milestones through distinct strategies.
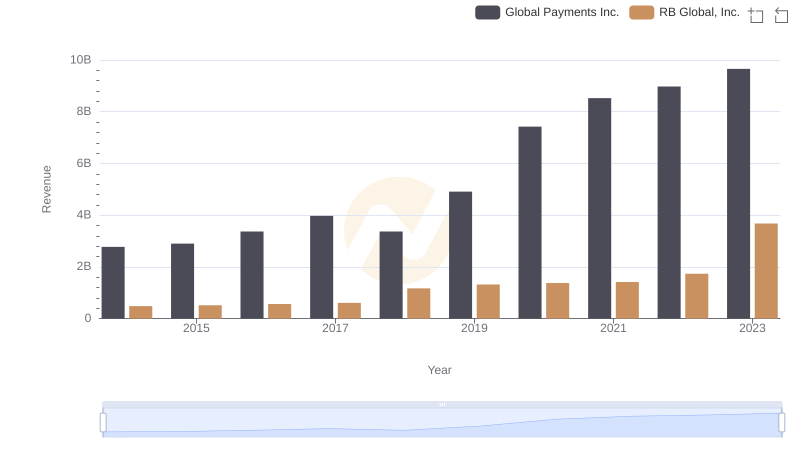
Comparing Revenue Performance: Global Payments Inc. or RB Global, Inc.?
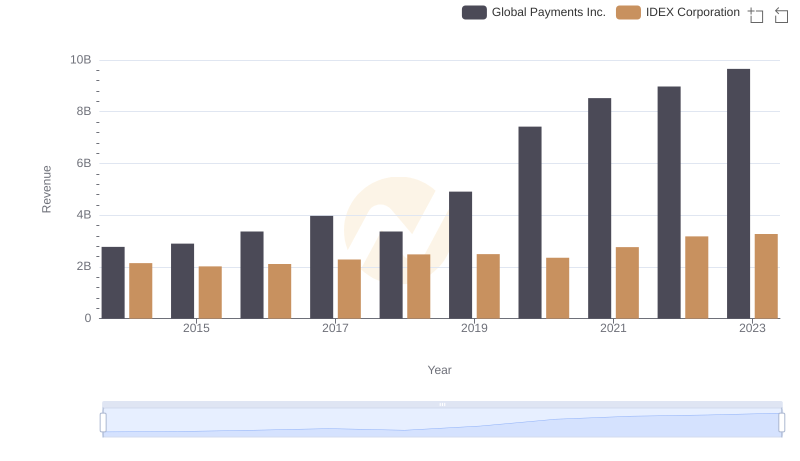
Comparing Revenue Performance: Global Payments Inc. or IDEX Corporation?
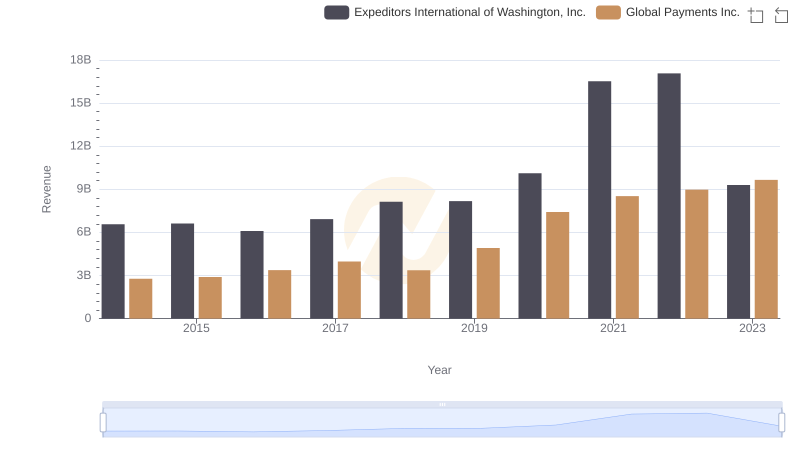
Global Payments Inc. or Expeditors International of Washington, Inc.: Who Leads in Yearly Revenue?
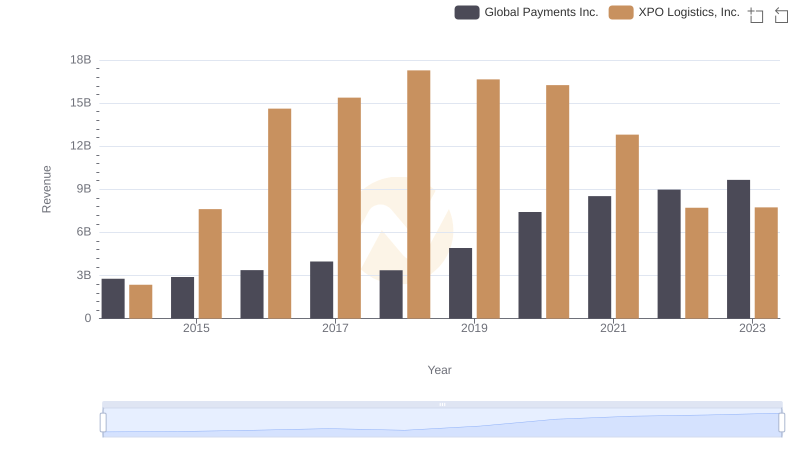
Breaking Down Revenue Trends: Global Payments Inc. vs XPO Logistics, Inc.
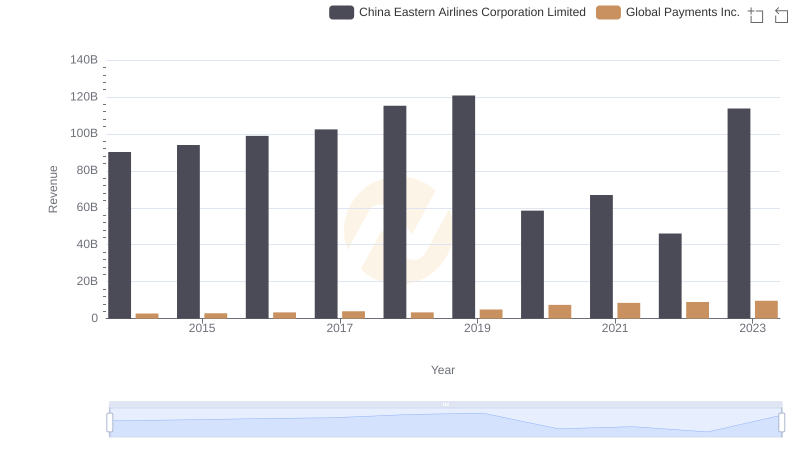
Who Generates More Revenue? Global Payments Inc. or China Eastern Airlines Corporation Limited
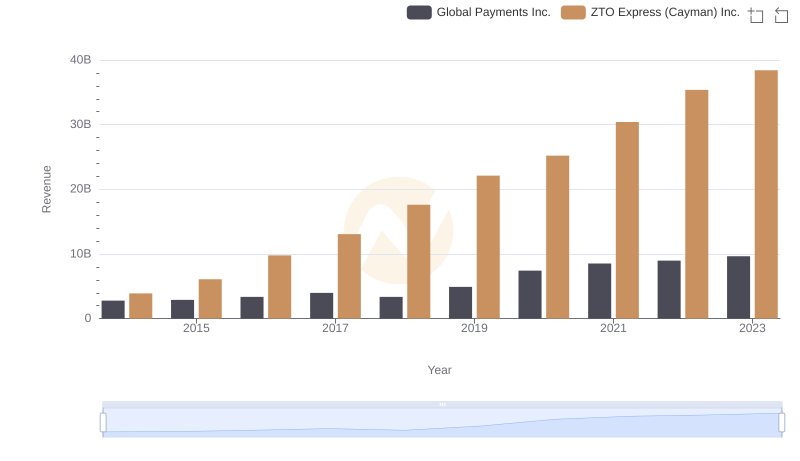
Who Generates More Revenue? Global Payments Inc. or ZTO Express (Cayman) Inc.
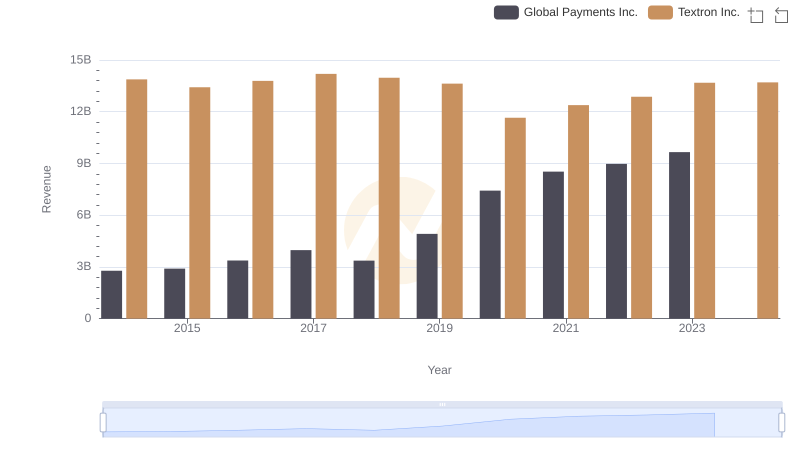
Global Payments Inc. and Textron Inc.: A Comprehensive Revenue Analysis
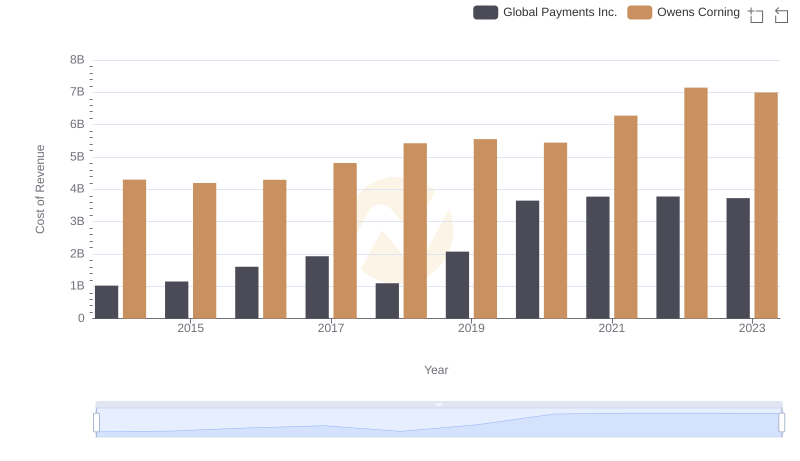
Cost of Revenue Trends: Global Payments Inc. vs Owens Corning
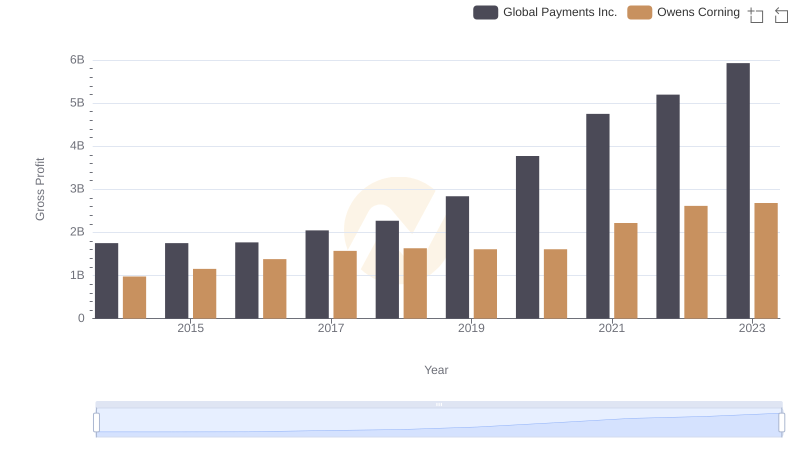
Global Payments Inc. and Owens Corning: A Detailed Gross Profit Analysis
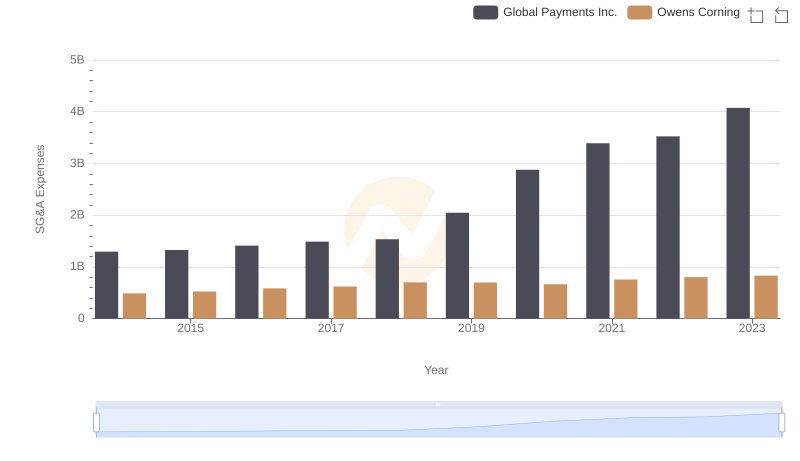
Global Payments Inc. and Owens Corning: SG&A Spending Patterns Compared
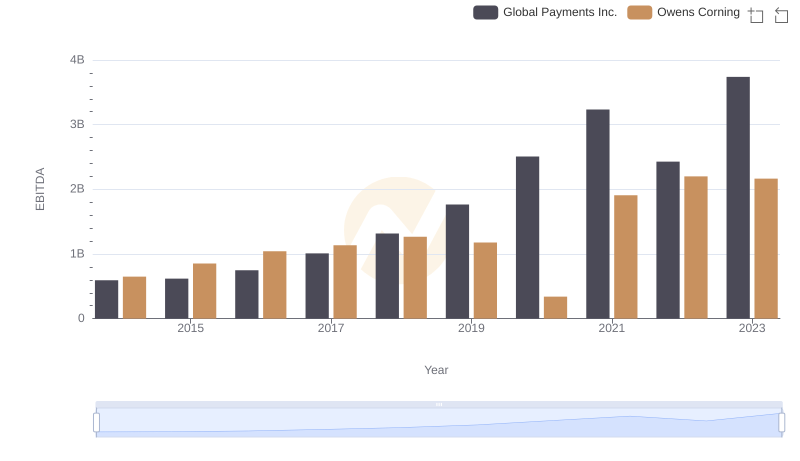
EBITDA Analysis: Evaluating Global Payments Inc. Against Owens Corning