| __timestamp | Global Payments Inc. | Owens Corning |
|---|---|---|
| Wednesday, January 1, 2014 | 1751611000 | 976000000 |
| Thursday, January 1, 2015 | 1750511000 | 1153000000 |
| Friday, January 1, 2016 | 1767444000 | 1381000000 |
| Sunday, January 1, 2017 | 2047126000 | 1572000000 |
| Monday, January 1, 2018 | 2271352000 | 1632000000 |
| Tuesday, January 1, 2019 | 2838089000 | 1609000000 |
| Wednesday, January 1, 2020 | 3772831000 | 1610000000 |
| Friday, January 1, 2021 | 4750037000 | 2217000000 |
| Saturday, January 1, 2022 | 5196898000 | 2616000000 |
| Sunday, January 1, 2023 | 5926898000 | 2683000000 |
| Monday, January 1, 2024 | 6345778000 |
Igniting the spark of knowledge
In the ever-evolving landscape of corporate finance, the gross profit trends of Global Payments Inc. and Owens Corning from 2014 to 2023 offer a fascinating glimpse into their financial trajectories. Over this decade, Global Payments Inc. has seen a remarkable growth in gross profit, surging by approximately 238%, from $1.75 billion in 2014 to nearly $5.93 billion in 2023. This growth underscores the company's robust expansion and strategic market positioning.
Conversely, Owens Corning, a leader in building materials, has experienced a steady yet modest increase of around 175% in gross profit, from $976 million in 2014 to $2.68 billion in 2023. This growth reflects the company's resilience and adaptability in a competitive industry. The contrasting growth rates of these two companies highlight the diverse challenges and opportunities within their respective sectors.
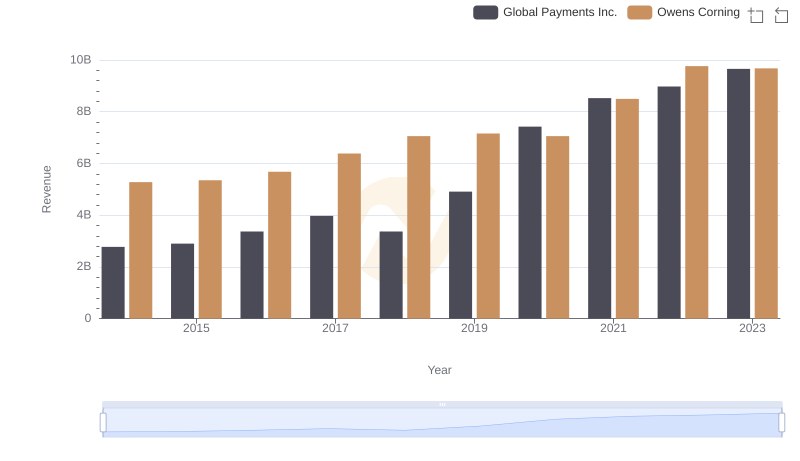
Global Payments Inc. or Owens Corning: Who Leads in Yearly Revenue?
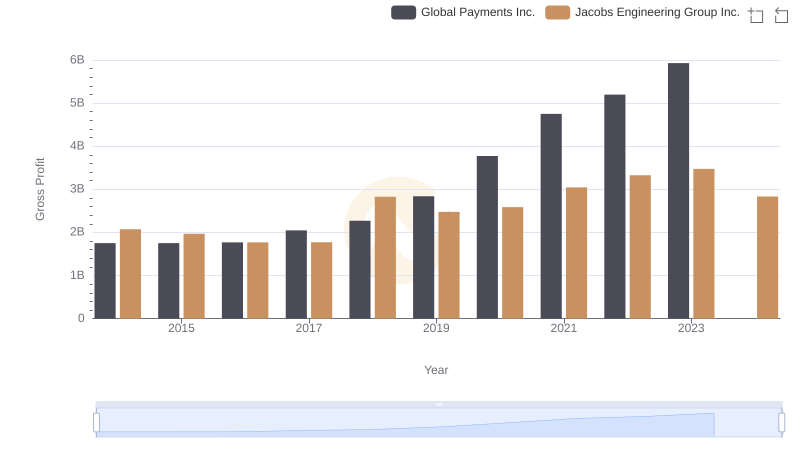
Global Payments Inc. vs Jacobs Engineering Group Inc.: A Gross Profit Performance Breakdown
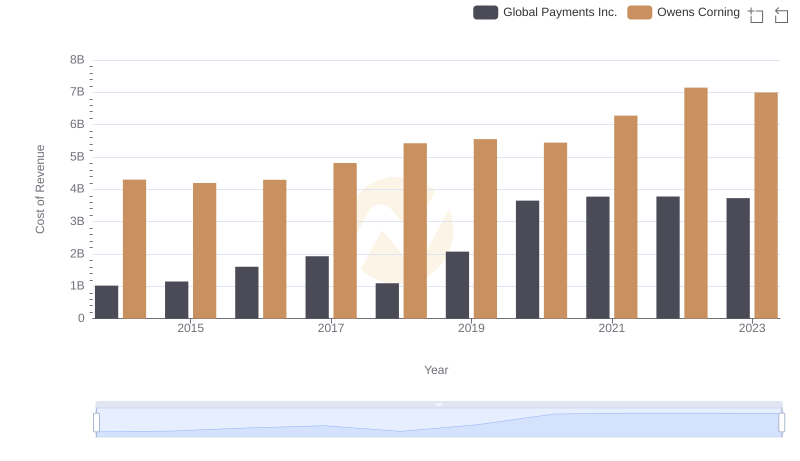
Cost of Revenue Trends: Global Payments Inc. vs Owens Corning
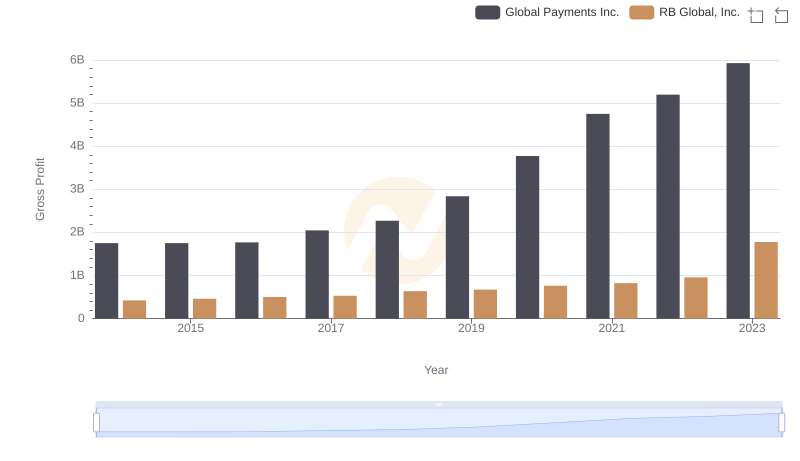
Gross Profit Comparison: Global Payments Inc. and RB Global, Inc. Trends
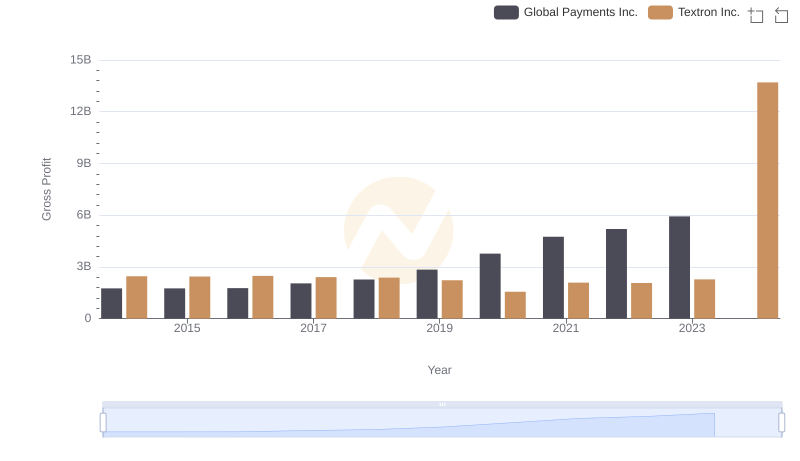
Key Insights on Gross Profit: Global Payments Inc. vs Textron Inc.
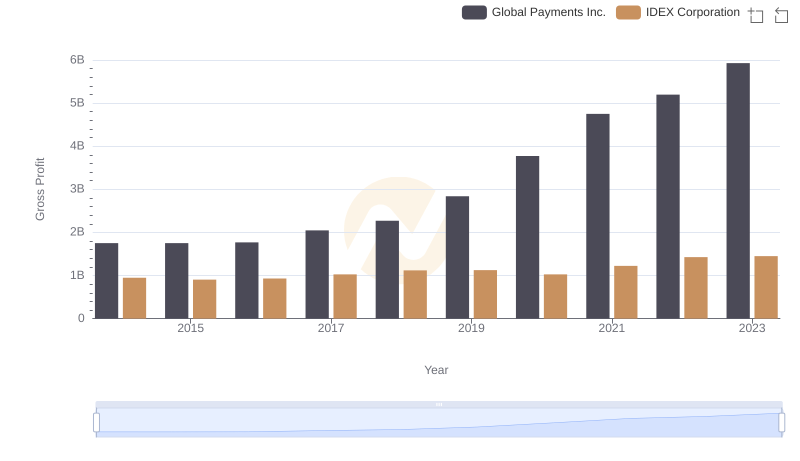
Gross Profit Comparison: Global Payments Inc. and IDEX Corporation Trends
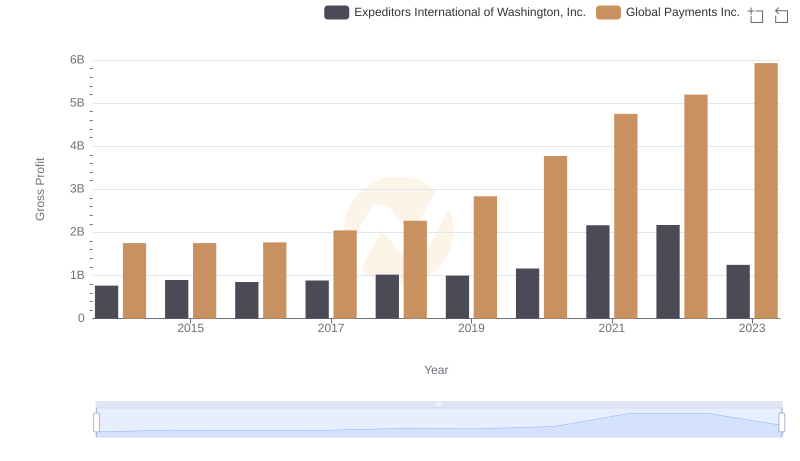
Gross Profit Trends Compared: Global Payments Inc. vs Expeditors International of Washington, Inc.
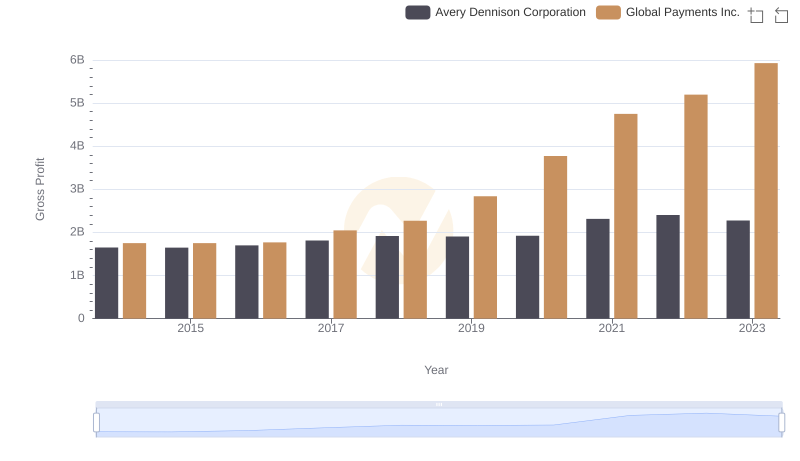
Global Payments Inc. vs Avery Dennison Corporation: A Gross Profit Performance Breakdown
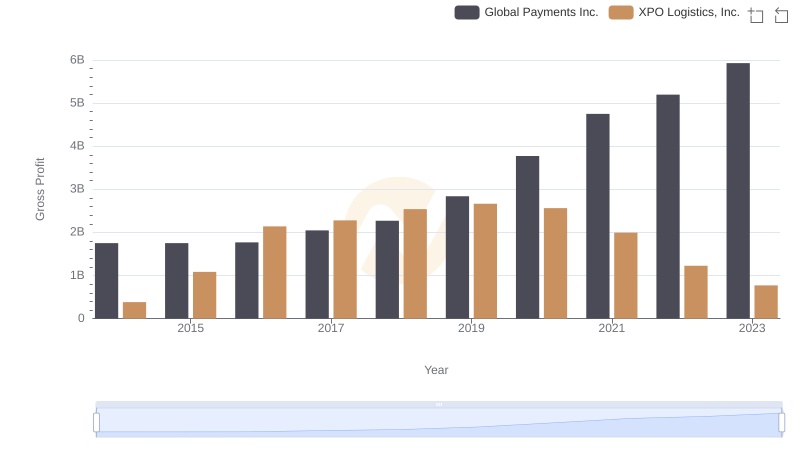
Gross Profit Analysis: Comparing Global Payments Inc. and XPO Logistics, Inc.
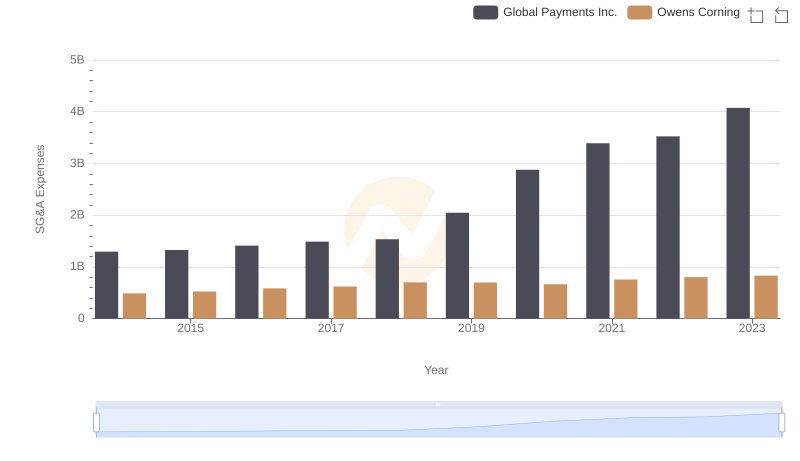
Global Payments Inc. and Owens Corning: SG&A Spending Patterns Compared
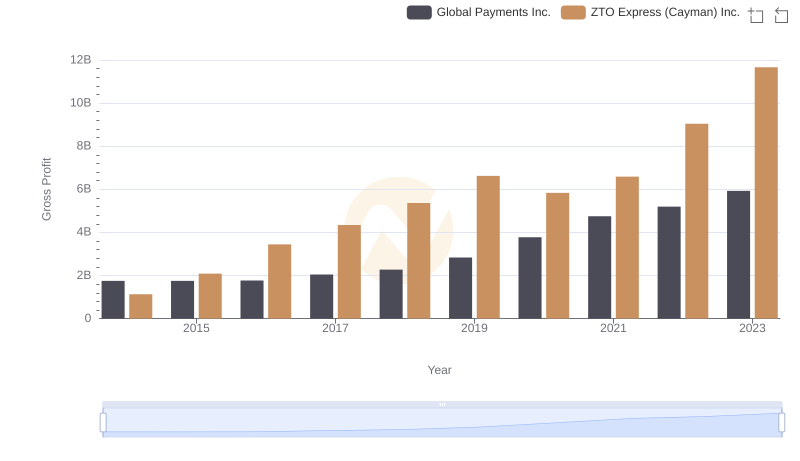
Global Payments Inc. vs ZTO Express (Cayman) Inc.: A Gross Profit Performance Breakdown
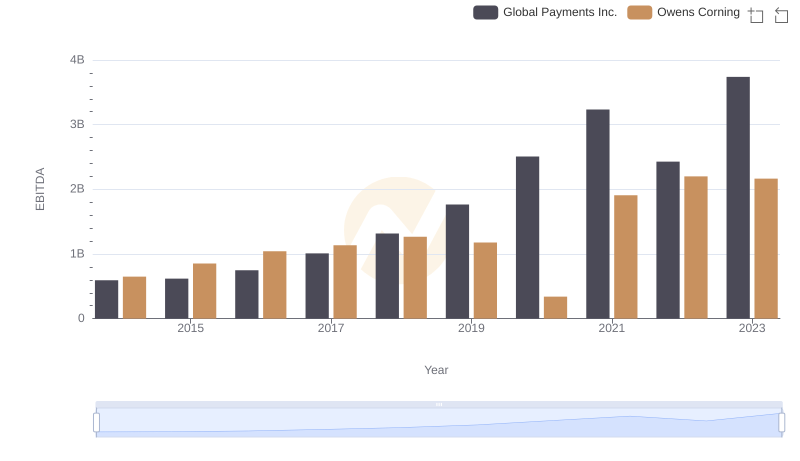
EBITDA Analysis: Evaluating Global Payments Inc. Against Owens Corning