| __timestamp | Expeditors International of Washington, Inc. | Global Payments Inc. |
|---|---|---|
| Wednesday, January 1, 2014 | 38125000 | 1295014000 |
| Thursday, January 1, 2015 | 41990000 | 1325567000 |
| Friday, January 1, 2016 | 41763000 | 1411096000 |
| Sunday, January 1, 2017 | 44290000 | 1488258000 |
| Monday, January 1, 2018 | 45346000 | 1534297000 |
| Tuesday, January 1, 2019 | 44002000 | 2046672000 |
| Wednesday, January 1, 2020 | 18436000 | 2878878000 |
| Friday, January 1, 2021 | 16026000 | 3391161000 |
| Saturday, January 1, 2022 | 24293000 | 3524578000 |
| Sunday, January 1, 2023 | 27913000 | 4073768000 |
| Monday, January 1, 2024 | 33331000 | 4285307000 |
Igniting the spark of knowledge
In the world of corporate finance, Selling, General, and Administrative (SG&A) expenses are a critical measure of a company's operational efficiency. This analysis compares the SG&A expenses of Global Payments Inc. and Expeditors International of Washington, Inc. from 2014 to 2023. Over this period, Global Payments Inc. has seen a staggering increase of over 200% in its SG&A expenses, peaking at approximately $4.07 billion in 2023. In contrast, Expeditors International's expenses have fluctuated, with a notable dip in 2020, reflecting a 60% decrease from its 2018 peak. This divergence highlights the contrasting business strategies and market conditions faced by these companies. As Global Payments Inc. expands its global footprint, its rising SG&A expenses underscore its aggressive growth strategy, while Expeditors International's more stable expenses suggest a focus on operational efficiency.
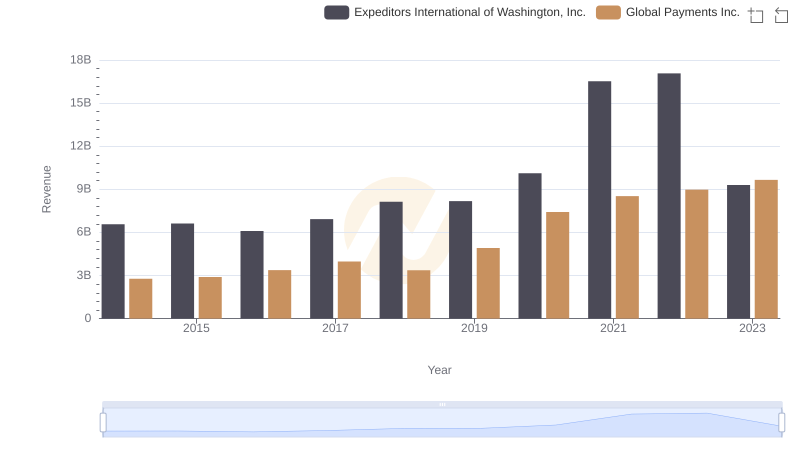
Global Payments Inc. or Expeditors International of Washington, Inc.: Who Leads in Yearly Revenue?
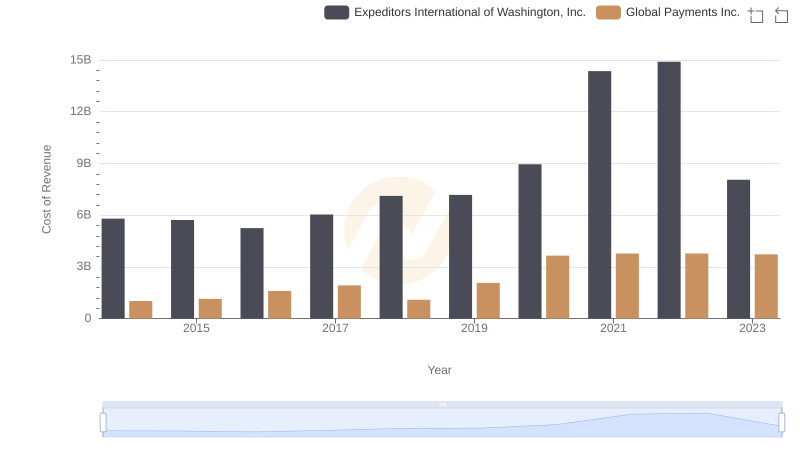
Analyzing Cost of Revenue: Global Payments Inc. and Expeditors International of Washington, Inc.
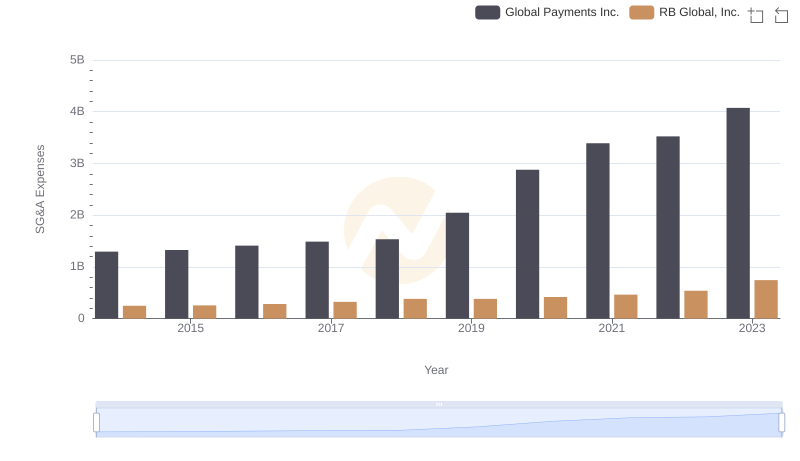
Cost Management Insights: SG&A Expenses for Global Payments Inc. and RB Global, Inc.
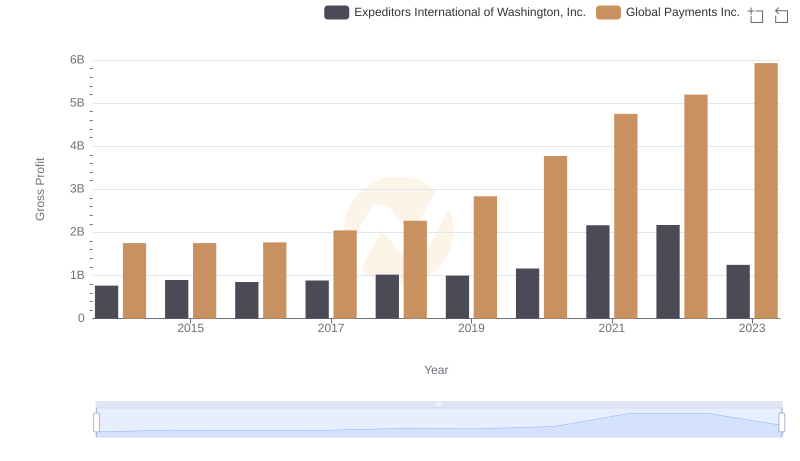
Gross Profit Trends Compared: Global Payments Inc. vs Expeditors International of Washington, Inc.
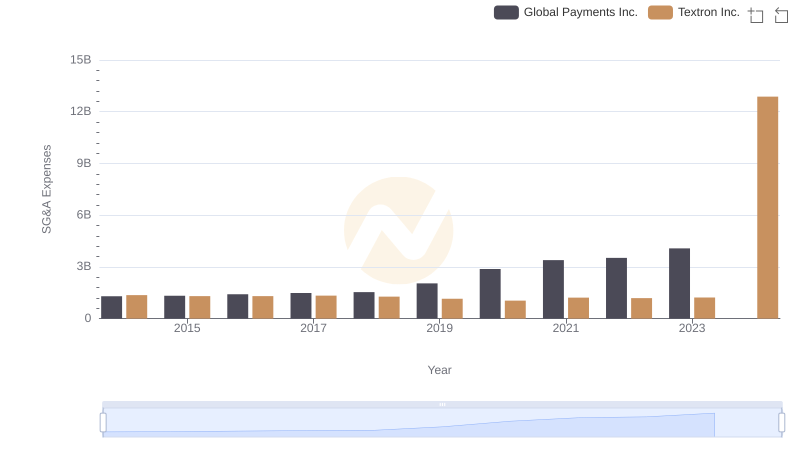
Cost Management Insights: SG&A Expenses for Global Payments Inc. and Textron Inc.
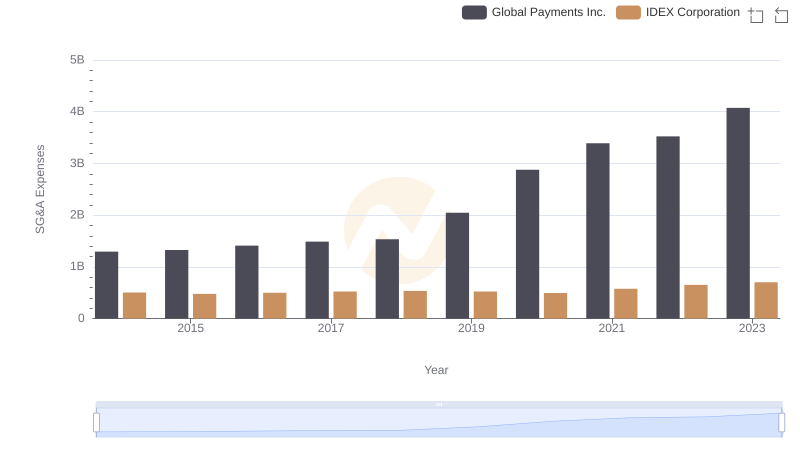
Who Optimizes SG&A Costs Better? Global Payments Inc. or IDEX Corporation
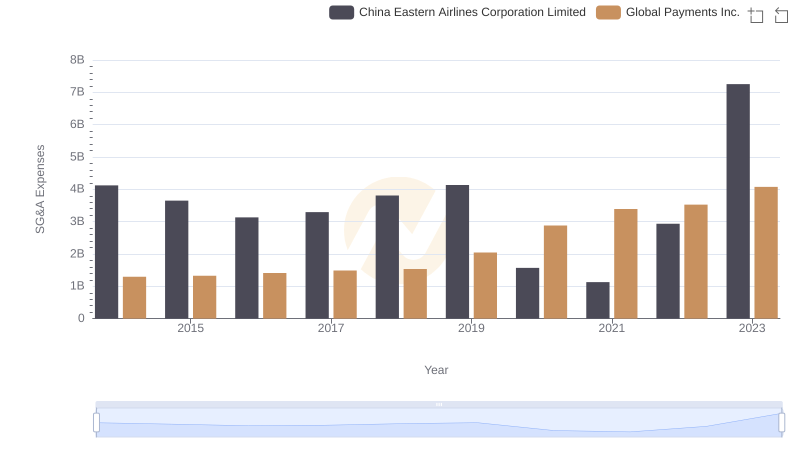
Global Payments Inc. vs China Eastern Airlines Corporation Limited: SG&A Expense Trends
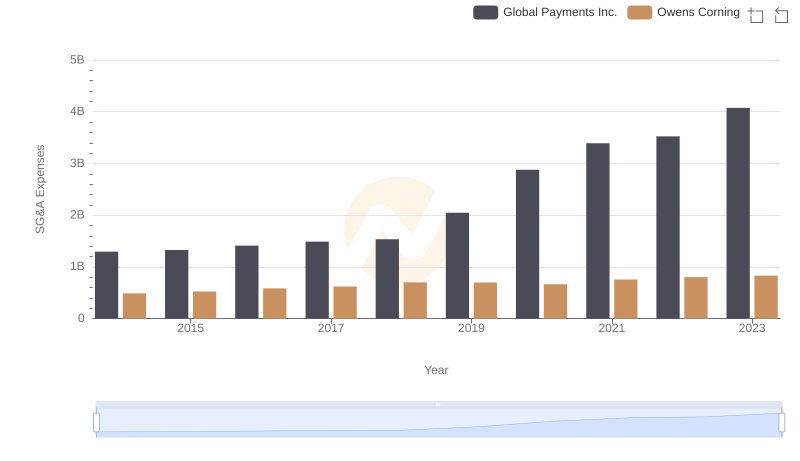
Global Payments Inc. and Owens Corning: SG&A Spending Patterns Compared
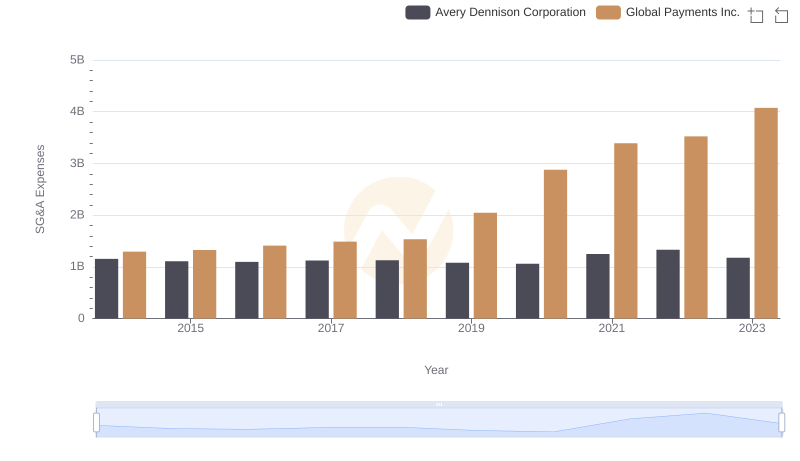
Comparing SG&A Expenses: Global Payments Inc. vs Avery Dennison Corporation Trends and Insights
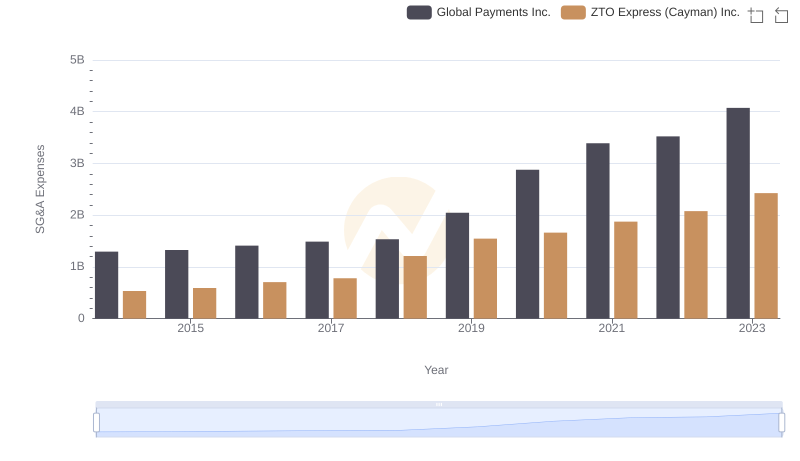
Selling, General, and Administrative Costs: Global Payments Inc. vs ZTO Express (Cayman) Inc.

Professional EBITDA Benchmarking: Global Payments Inc. vs Expeditors International of Washington, Inc.
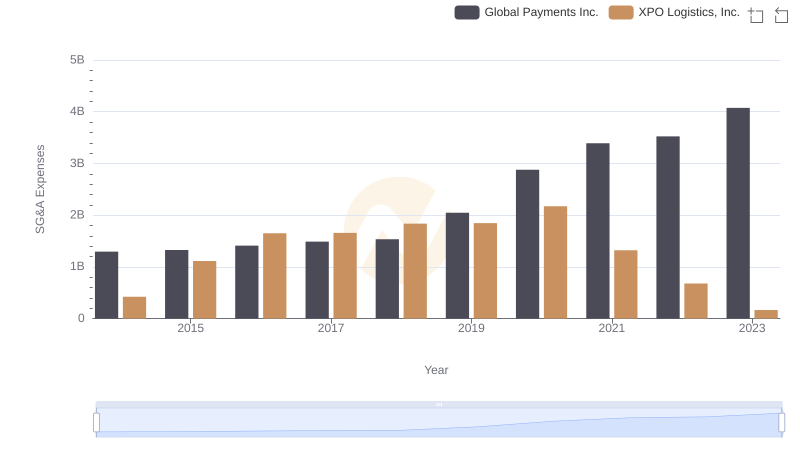
SG&A Efficiency Analysis: Comparing Global Payments Inc. and XPO Logistics, Inc.